Author: Anastasios Stamoulakatos

  • Evaluating the creativity of AI systems

    “Measuring the unmeasurable. Ranking the unrankable.“

    In the rapidly evolving landscape of Artificial Intelligence (AI), two questions remain particularly elusive and particularly consequential:

    1. Can AI be truly creative? 2. Can we rank AI agents based on their creativity?

    These are not rhetorical questions. They are the founding hypotheses of this project.

    The first touches on something that has historically felt beyond measurement: the quality of an original idea. The second demands a fair, repeatable, and objective method for comparison across different types of players, at scale. This challenge is especially sharp in advertising, where creative ideas are the currency of impact. Traditional evaluation relies on subjective human judgment which can be slow, expensive, and inconsistent across reviewers. At the same time, as Large Language Models (LLMs) transform tasks from coding to translation, a critical gap has persisted: how do we benchmark creativity rigorously?

    At the WPP Research, we ran a set of experiments demonstrating that modern LLMs can act as reliable, scoring agents that grade creative ideas across multiple established dimensions with measurable consistency. That finding unlocked something important: if an LLM can judge creativity, we can build a system that does so systematically and then use that system to rank which AI creates the best ideas. The Creativity Evaluation Agent is a modular, multi-agent system built at WPP Research that pursues two distinct but deeply intertwined goals:

    Goal 1: Build a scalable creative evaluation engine

    Design and deploy an AI agent, capable of evaluating any marketing campaign idea automatically and consistently, across six industry-grounded creativity frameworks simultaneously. A user submits a campaign idea (text or PDF) via the web UI or API. Then, our multi-agent system evaluates it across all six frameworks in parallel and returns a structured report with dimension-level scores and qualitative commentary in 15–25 seconds.
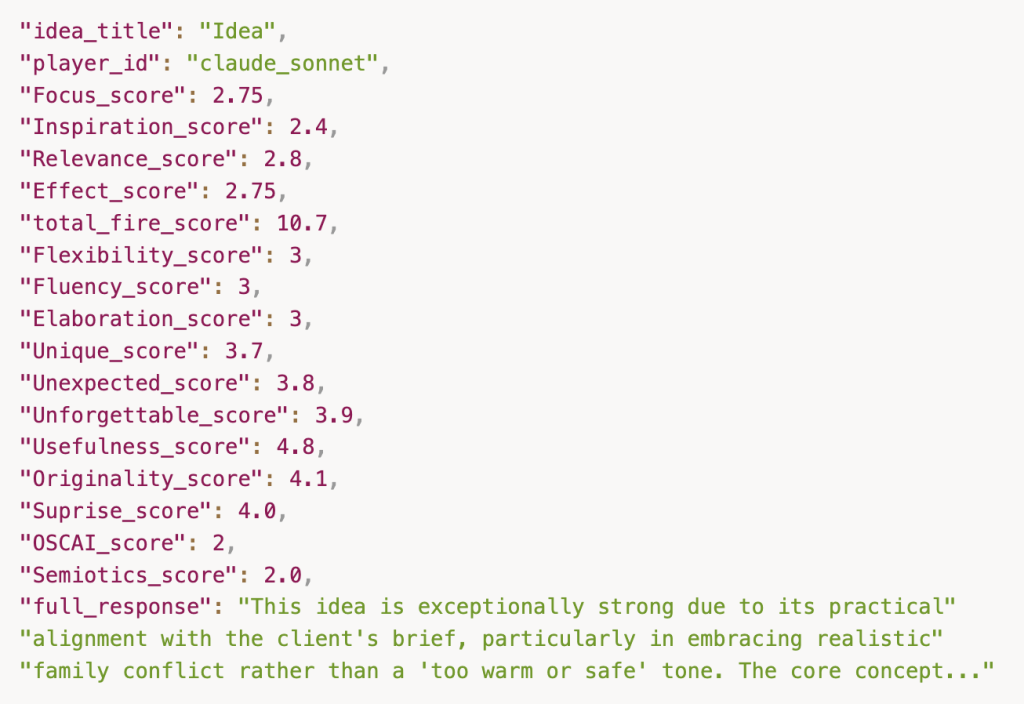
    Figure 1: Example output for a creative idea

    Goal 2: Benchmark who creates the best ideas: LLMs, humans, and AI agents

    The evaluation engine is also the foundation of a creative benchmarking tournament. The second goal is to use the agent as an objective judge to measure and rank the creative output of different players. For this exercise the players have been state-of-the-art LLMs.
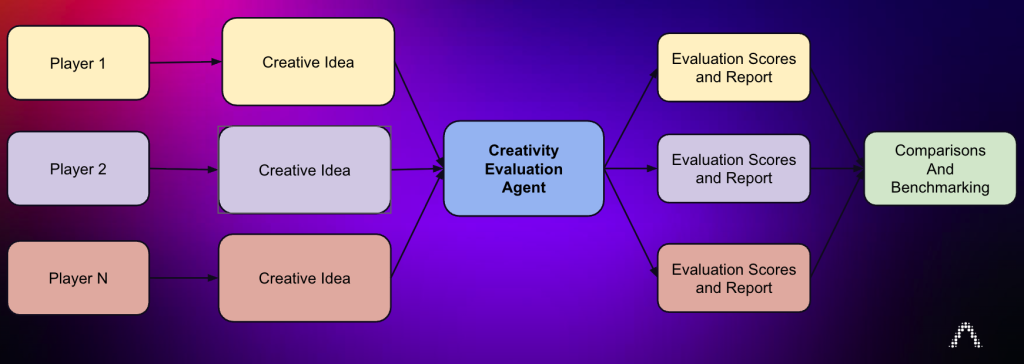
    Figure 2: Creative benchmarking tournament

    To do this rigorously, we adopted the Glicko2 rating system (also used in games such as chess Elo, Counter Strike and Dota 2), running a round-robin tournament where each player’s ideas compete head-to-head. The result is a continuously updatable creative leaderboard which ranks AI creativity in advertising.


    From foundations to architecture

    To move from subjective opinion to objective evidence, the system stands on the shoulders of giants, synthesising established psychometrics like the Torrance Tests of Creative Thinking (TTCT) with industry-proven frameworks. The challenge lies in translation: turning these theoretical foundations into an autonomous agent capable of automated creativity evaluation with human-like nuance and explainable logic supported by a confederacy of specialised models.

    The multi-agent ecosystem

    Rather than relying on a single monolithic judge, the system orchestrates a specialised “squad” of sub-agents, each one encoding a distinct evaluation technique from creativity science or brand strategy. Some measure the quality of the output — how effective, original, and strategically durable the idea is. Others measure the quality of the thinking — how expansive, surprising, and culturally grounded the generative process behind it is. Together, they cover the full spectrum from practical effectiveness to creative cognition.

    AgentWhat It MeasuresGrounded In
    Effectiveness (WPP)Does the idea work as a campaign? How sharply framed, how boldly inspired, how relevant, how impactful?Proprietary WPP creativity framework built around four dimensions of creative excellence, calibrated against real campaign performance across multiple brands and markets. Inspired by research on inspiration published in Harvard Business Review, the framework evaluates the “DNA of what makes ideas inspiring.”
    Generative Flow (FFE)How broad and varied is the thinking? Does the idea explore multiple formats, categories, and angles?FFE (Fluency, Flexibility, Elaboration) dimensions from creativity research, benchmarked against marketing creativity datasets.
    Divergent Creativity (UOS)Is the idea useful, original, and surprising?UOS (Usefulness, Originality, Surprise) framework from divergent thinking literature.
    Creative Strategist (UUU)Is the idea unique, unexpected, and unforgettable enough to endure?UUU (Unique, Unexpected, Unforgettable) brand longevity assessment, utilising multi-domain evaluation techniques.
    Conceptual Distance (OSCAI) ([OSCAI – LLM ScoringOpen Creativity Scoring](https://openscoring.du.edu/ocsai))How far apart are the connected concepts? Distinguishes mundane links from highly original leaps.
    SemioticsHow is meaning constructed through cultural symbols? Is the creative execution aligned with the intended brand message?Saussurean sign systems and cultural logic.

    Table 1: Scores description


    How the agents work: scoring architecture and self-correction

    Every sub-agent is governed by the same rigorous four-part prompt architecture. Each is anchored by a specialised Role that encodes its evaluation lens, followed by a granular Definition of Score that translates abstract dimensions into measurable benchmarks. The core logic is driven by precise Instructions calibrated against few-shot examples drawn from a ground truth library of ideas and historical scores. This architecture feeds into a Critic-Refiner cycle, where specialised Refiner agents challenge initial assessments and resolve contradictions. The refinement doesn’t trigger on every run, but its presence is deliberate: we observed during evaluation that LLMs had a tendency towards optimism in scoring, and this self-correction layer ensures the final output remains robust and consistent.

    In other words, the agent descriptions above define what each agent evaluates; the shared architecture is how they all do it.
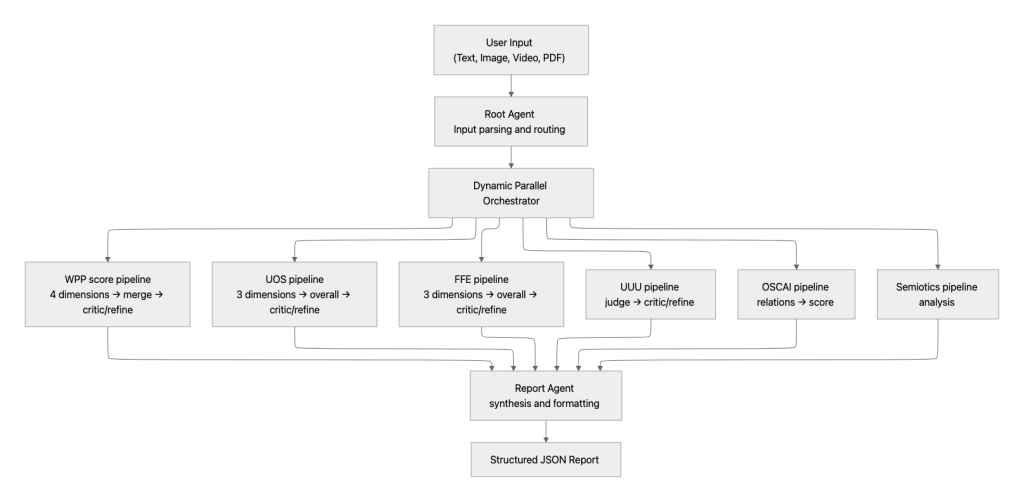
    Figure 3: The architecture of the Creativity Evaluation Agent.

    Aligning sub-agents with human intuition

    Before trusting the system, we needed to prove it thinks like a human Creative Director. We assembled a Ground Truth dataset in collaboration with WPP creative professionals: 20 campaign ideas, each captured as a title and description, scored by consensus using the WPP effectiveness score. We then ran each idea through our evaluation pipeline across three frontier models and measured the prediction error.

    ModelAvg. Error (Agent vs. Human Scores)
    Gemini 2.52.2
    Claude Sonnet 4.51.0
    Gemini 30.7

    Table 2: Model comparison

    Gemini 3 emerged as the definitive choice and was deployed across all sub-agents. We also validated repeatability: the same idea, scored across independent runs, held stable with low standard deviation across all frameworks. The WPP score was the most precise signal, but UOS, FFE, and UUU all showed the same core reliability.
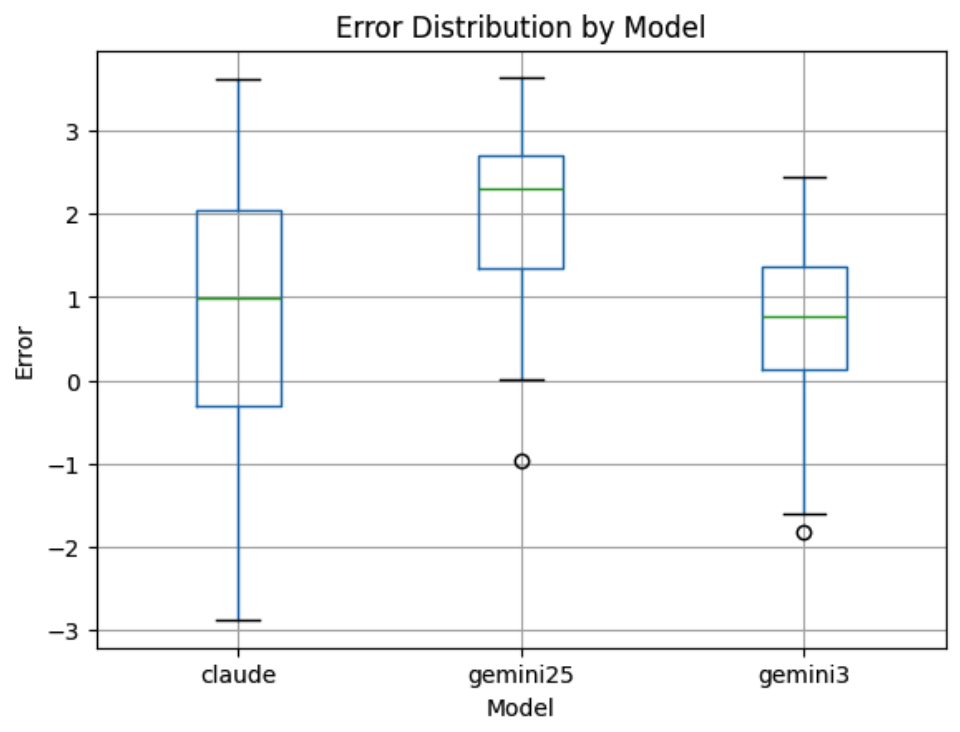
    Figure 4: error distributions of the creative evaluation agent when powered by Claude Sonnet 4.5, Gemini 2.5 and Gemini 3.

    The takeaway: our benchmarks are grounded in data, not AI randomness. Repeatability is a measured property of this system and not an assumption.

    Case study

    With the agent LLM validated, we moved to a real-world stress test for a furniture company. This challenge asked different LLMs to tackle a nuanced brief rooted in a specific cultural tension: North Asian families with millennial parents and preteen children are living under the same roof but feeling worlds apart — clutter, gaming, and conflicting needs for “me time” vs. “we time” are eroding family connection. The brief demanded ideas that were cross-market, minimal-dialogue, and crucially, not too warm or safe.

    Each LLM’s output was run through the full evaluation ecosystem. Every sub-agent independently scored the idea along its respective dimension, and the resulting sub-scores were summed into a single composite total.

    To generate the ideas, we used both standalone frontier LLMs (GPT-5, Gemini 3, Claude 4.5 Sonnet) and WPP’s Creative Brain — a multi-agent ideation system available through WPP Open’s Agent Hub that wraps an LLM in a structured creative process, guiding it through strategic reframing, lateral thinking, and iterative refinement before producing a final concept. By testing Creative Brain alongside standalone models, the challenge reveals how much of creative quality comes from the model itself versus the orchestration around it.

    Because the raw evaluation pillars operated on different scales — WPP uses a 0–12 sum, FFE averages to 0–3, while UOS and UUU average to 0–5 — direct comparison across pillars was misleading. All scores were normalized to a common 0–10 range so that each pillar contributes equally to a maximum total of 40.

    It should be noted that two scoring sub-agents, OSCAI and Semiotics were excluded from the evaluations because of their high scoring variance (see Section 3.6 of the technical report).

    1. GPT-5: the gamification grandmaster

    GPT-5 led the pack with a total score of 37.44. Its winning strategy, “Co‑op Mode: Make Home Happen,” reframed the entire experience of home life as a collaborative video game the whole family plays together. The central insight: small home changes don’t stick because they don’t feel rewarding but games do. By turning clutter into the “boss” and the furniture company’s solutions into unlockable “side quests,” GPT-5 built an end-to-end ecosystem that made organisation feel joyful rather than obligatory.

    PillarInitiativeDescription & Impact
    1. Launch Film“Clutter is the Boss”A 60s hero film where a family’s living room transforms into a co‑op game interface—prompts like “Inventory Full” and “Find Calm” appear as they “equip” products to defeat the clutter boss. No spoken lines, region-agnostic SFX. Reframes organisation as play; makes the campaign cross-market viable without localisation.
    2. Social/UGC“Home Side Quests”Weekly micro-challenges (under 10 min) like “Create a charging dock” or “Flip sofa to study.” Augmented Reality (AR) filters add level meters and badges; families post before/afters to the #CoOpHome Challenge with creator duets from gaming and parent influencers. Drives sustained engagement and organic reach through participatory content.
    3. Retail/Shoppable“Co‑op Kits”Curated in-store and online bundles organised by mission—Study Calm, Party Fast Reset, Balcony Green Break—each bundling storage + lighting + organisers. Every kit includes a QR “Quest Card” guiding micro-steps with estimated time saved. Turns the purchase into the start of a new quest; bridges content to commerce.
    4. In-Store Experience“Demo Levels”Stores host timed tidy-up challenges where kids and parents compete together to reorganise a mock room against the clock. Winners earn collectible stickers and discount codes. Transforms the retail visit into an extension of the campaign’s game logic; drives foot traffic through experiential play.
    5. Digital Ads“Skip the Clutter”YouTube bumpers using skip-button logic—”Skip the clutter in 3…2…1″—to land a single, punchy product solve within seconds. Leverages ad format mechanics as creative device; delivers product utility in pre-roll.

    Table 3: Campaign idea produced by GPT-5.

    The campaign’s minimal-dialogue, SFX-driven creative approach ensured cross-market viability across North Asian markets without localisation, while the consistent game language (“side quests,” “boss,” “level up,” “equip”) created a unified system that scored perfect on coherence. Every asset closed with the same recontextualised tagline: “Furniture company. Make Home Happen.”, framed not as an aspiration, but as a mission objective.

    2. Creative Brain powered by Gemini: the multiverse architect

    The Creative Brain powered by Gemini followed closely with a score of 36.95. Its “Room-Sync Chronicles” campaign took a fundamentally different approach: rather than gamifying the solution, it gamified the problem. The central reframe, that every piece of “clutter” in a preteen’s bedroom is actually a physical anchor for their digital and imagined worlds — gave parents a radically empathetic lens through which to see their child’s space. The furniture company storage wasn’t positioned as a way to “hide the mess” but as a way to “power the multiverse.”

    PillarInitiativeDescription & Impact
    1. Launch Film“Reality Reboot”A cinematic 60s spot where a mother opens her son’s door and sees a mess—but the room “glitches” into a high-fidelity game landscape. A box unit becomes a loot chest; a gaming chair becomes a pilot’s cockpit. VFX borrows from game trailers. Subverts the “messy room” trope by revealing the child’s imaginative reality; makes furniture feel epic.
    2. Narrative Arc“Co-Op Reorganisation”The film follows mother and son “co-oping” a reorganisation — but the goal isn’t to clean. It’s to “optimise the map” for his next quest. Storage becomes power-ups that expand the room’s modes: gaming arena, creative studio, family bonding zone. Reframes tidying as collaborative strategic upgrade, not parental demand.
    3. Social/AR“Skin Your Room”A social platform where kids apply AR filters to their real rooms, overlaying fantasy skins that reveal the “epic reality” hidden behind the furniture. Kids share their “skinned” rooms with parents to bridge the perception gap.
    4. Brand Positioning“Powering the Multiverse”Storage is repositioned as an identity enabler for developing preteens — a tool that supports creativity, gaming, and emerging selfhood. Storage doesn’t organise a room; it powers the multiverse being built inside it. Elevates product value proposition from functional to emotional and developmental.
    5. Strategic InversionChild-First PerspectiveThe campaign validates the preteen’s perspective first, then invites the parent in, inverting the typical home-brand default of centering the adult buyer’s desire for order. Boldest strategic choice in the cohort; highest risk, highest differentiation.

    Table 4: Campaign idea produced by Creative Brain.

    Underlying the entire campaign was a provocative strategic choice that the evaluator flagged as both its greatest strength and its primary risk: centering the child’s worldview over the parent’s. Where most home brands default to the adult buyer’s desire for order, Room-Sync starts from the preteen’s experience and invites the parent to see through their eyes. This inversion earned it the cohort’s highest Unforgettable score, but the Creative Evaluation Agent noted the heavy RPG metaphor might alienate parents unfamiliar with gaming culture.


    3. Claude Sonnet 4.5: the reality show provocateur

    Claude Sonnet 4.5 followed with a score of 35.12. Its “The Remodel Squad” strategy took the most grounded, human-first approach of the cohort. Where GPT-5 and Gemini leaned into fantasy and gamification, Claude leaned into documentary authenticity, positioning real family friction not as a problem to be solved but as the raw material for genuine connection. The core creative bet: audiences are tired of aspirational perfection and will respond to the messy, funny, emotional truth of families actually trying to share space.

    PillarInitiativeDescription & Impact
    1. Launch Film“The Beautiful Mess”A 60s hero spot showing a parent-child duo hilariously debating the furniture company’s storage solutions, arguing over shelf heights, drawer labels, and who gets the corner nook. The punchline: they both want the same thing. Designed to feel like a documentary moment, not an ad; builds instant relatability.
    2. Content Series“The Remodel Squad”6–8 episodes (5–8 min each) where real families nominate the room causing the most conflict. One preteen + one parent form a “Remodel Squad” to transform it using the company’s solutions but they must agree on every single decision. Captures hilarious negotiations, compromises, and breakthroughs. Friction becomes the creative fuel; the format is inherently dramatic and bingeable.
    3. Episode StructureThree-Act ArcEach episode follows: (1) the conflict audit (what’s wrong, who’s to blame), (2) the design negotiation (friction-fueled creative process), (3) the heartwarming reveal — not a “ta-da” moment, but the family’s first natural interaction in the new space. Emotional payoff is relational, not just spatial.
    4. Social/Viral“15-Second Cutdowns”Bite-sized content isolating the series’ most relatable moments: funniest negotiation standoffs, most dramatic before/afters, quiet breakthrough moments. Designed as standalone viral units that drive viewership back to full episodes. Engineered for shareability across short-form platforms.
    5. Interactive Tool“Conflict Zone” AR AppFamilies scan their own problem rooms and collaboratively visualise the company’s solutions in situ. Families can tag their room’s “conflict level” and share proposed redesigns. Emphasis on joint decision-making over individual play. Extends the show’s premise into every family’s home; sparks “productive arguments.”

    Table 5: Campaign idea produced by Claude Sonnet 4.5.

    The campaign’s greatest strength was its emotional granularity. Rather than offering a single visual payoff, each episode promised a different family, a different room, and a different set of negotiations — creating a content engine with built-in variety and repeatability. The Creativity Evaluation Agent awarded it the cohort’s highest Usefulness score, for its practical alignment with the brief’s tone requirements, but noted that reality-renovation formats carry inherent category familiarity, reflected in its lower Uniqueness score. Every piece of content closed with the family in their transformed space and the line: “Make Home Happen.”


    4. Gemini 3: the diplomatic provocateur

    Gemini 3 rounded out the cohort with a score of 32.48. Its “The Domestic Peace Accords” took the boldest tonal swing of the group, making a singular creative bet: position the furniture company’s products as essential diplomatic tools to resolve the “cold war” between generations, executed entirely through the visual grammar of geopolitical thrillers. Where other entries built broad ecosystems, this idea invested everything in the power of one perfectly realised metaphor.

    PillarInitiativeDescription & Impact
    1. Core Metaphor“Furniture as Diplomacy”The parent-preteen conflict is reframed as a genuine geopolitical standoff — a “cold war” between factions with irreconcilable demands (minimalist calm vs. messy independence) over limited territory (square footage). The products are repositioned as “diplomatic tools” that broker peace. Elevates a mundane domestic problem to dramatic, absurd, memorable heights.
    2. Launch Film Series“The Negotiations”Spots filmed in the style of high-stakes political thrillers, Tinker Tailor Soldier Spy meets a bookcase. Parent and preteen sit at opposite ends of a long table in a dim, dramatically lit room, sliding “terms” across: a pegboard for gaming gear in exchange for a clean floor; a sound-absorbing curtain for privacy in exchange for family dinner attendance. Every product is a bargaining chip with a story.
    3. Visual Payoff“Treaty Signed”Each spot resolves in a single, sharp cut: the dim negotiation room gives way to a bright, airy, reorganised living space where both parties co-exist happily. The tonal whiplash from spy-thriller gravity to domestic warmth is the joke. Designed to be the defining shareable moment audiences remember and recount.
    4. Product as PlotNarrative IntegrationUnlike campaigns where products are set dressing, every item functions as a narrative object, a concession, a peace offering, a treaty clause. The pegboard isn’t “organised storage”; it’s the term that bought a clean floor. The bin is the clause that secured family movie night. Gives each product a story and a reason for being that transcends traditional placement.
    5. Tagline Reframe“Make Home Happen” as TreatyThe company’s existing tagline is repositioned not as an aspiration but as the terms of a negotiated truce, smart organisation that lets parents reclaim visual calm while granting preteens the “cool functional territory” they demand. Breathes new strategic life into existing brand language.

    Table 6: Campaign idea produced by Gemini 3.

    The Domestic Peace Accords had the strongest semiotic coherence – every element, from language (“cold war,” “treaty,” “terms”) to visual style (dim thriller lighting vs. bright domestic reveal) to product role (bargaining chips), reinforced one unified meaning system without contradiction while it also scored the highest Unexpected rating. However, its singular focus proved to be a double-edged sword: by investing entirely in one metaphor executed through one format (film spots), it presented no secondary executions, platforms, or conceptual categories**,** pulling its Total FFE down.


    The top contenders

    ModelWPP ScoreFFE scoreUOS scoreUUU scoreTotal Score
    GPT-59.5010.009.608.3437.44
    Gemini 3 (Creative Brain)9.2110.009.408.3436.95
    Claude Sonnet 4.58.9210.008.607.6035.12
    Gemini 38.756.679.207.8632.48

    Table 7: Final individual and total scores of the 4 different LLMs for the furniture company case study.

    Three of four models scored a perfect FFE (10.00), meaning raw creative thinking was comparable across the board. The separation came from WPP Score and UOS.

    GPT-5 posted the highest WPP (9.50). The WPP Agent cited “multiple direct pathways to purchase and engagement” and noted “exceptional focus on the stated business challenge.” The UOS Agent awarded 9.60: “meticulously crafted, creatively addressing every aspect of the client’s brief with seamless logical flow.”

    Creative Brain matched GPT-5 on FFE (10.00) and UUU (8.34). The UUU Agent noted “the core visual of the room ‘glitching’ into an RPG world creates an incredibly strong and distinct defining moment.” The WPP gap (9.21 vs. 9.50) traced to a coherence flag: “the heavy reliance on gaming metaphors might alienate or confuse parents who are not immersed in digital culture.”

    Claude Sonnet 4.5 earned the cohort’s highest Usefulness score — the UOS Agent praised its “practical alignment with the client’s brief, particularly in embracing realistic family conflict rather than a ‘too warm or safe’ tone.” The UUU Agent observed it “takes a common format (reality renovation show) and infuses it with a fresh twist” — but the format itself limited differentiation.

    Gemini 3 earned the highest Unexpected rating — the UUU Agent called the “juxtaposition of the mundane struggle for space with the gravitas of political thriller negotiations a brilliant flip.” But the FFE Agent recorded zero Flexibility: “a single, unified marketing campaign concept” with “no multiple distinct conceptual categories,” and the WPP Agent noted it “doesn’t create a new utility or platform.”


    The creative Elo tournament

    A single brief can’t tell us which model is consistently creative. To answer that, we expanded the experiment: each model was given multiple diverse briefs spanning different brands, categories, and creative challenges, and every output was scored by the same evaluation pipeline.

    We needed a ranking system that captured consistency against competition — not just average scores. An Elo rating is a numerical score that reflects a competitor’s relative skill based purely on head-to-head outcomes. The higher the rating, the stronger the performer. We turned to Glicko-2, the rating algorithm used in competitive chess, CS:GO, and Dota 2. Every head-to-head match is a data point: if idea A beats idea B, A gains rating and B loses it. Glicko-2 also tracks rating deviation (RD) — a confidence interval that shrinks with more matches.

    The players

    • GPT-5
    • Gemini 3
    • Gemini 2.5
    • Claude Sonnet 4.5
    • Creative Brain — built on Gemini 3 with an optimised prompting architecture

    Four models received a standardised prompt. The Creative Brain received the same brief but processed it through its own multi-agent ideation pipeline — testing whether orchestration outperforms raw model capability.

    The Creativity Evaluation Agent judged every idea independently. An orchestration engine simulated head-to-head matches by comparing normalised scores for the same brief. The winner of the matches is the one that has higher normalised composite score on common metrics. The result: 210 unique creative matches across 5 models and 14 global brands, run over 3 iterations.

    The results

    Ranked across WPP Score

    RankPlayerRatingRD
    🥇Creative Brain (Gemini 3)188984.8
    🥈GPT-5185892.3
    🥉Claude Sonnet 4.5152983.9
    4Gemini 3116990.7
    5Gemini 2.5962104.2

    Table 8: Elo ratings on the WPP score.

    Ranked across all frameworks

    RankPlayerRatingRD
    🥇GPT-5194084.3
    🥈Creative Brain (Gemini 3)192779.2
    🥉Claude Sonnet 4.5137877.4
    4Gemini 3121686.6
    5Gemini 2.5861106.3

    Table 9: Elo ratings across all frameworks.

    Creative Brain leads on WPP criteria — delivering a measurable advantage when judged against industry-specific creative standards. The gap between Creative Brain and standalone Gemini 3 is nearly 720 rating points. GPT-5 is the strongest all-rounder — topping the all-frameworks leaderboard with ideas that score well across the broadest range of creative dimensions.


    Key insights & findings

    • Creative Brain dramatically outperforms standalone Gemini 3. Same underlying model, ~720 rating point gap. The structured ideation process consistently elevated creative output beyond what Gemini 3 could produce alone. Notably, Creative Brain was not optimised against the WPP scoring criteria — its strong performance emerged naturally from a better creative process.
    • The right judge model is foundational. It can be seen in Figure 4 that Gemini 2.5 averaged 2.2 error against human ground truth; Claude Sonnet narrowed it to 1.0; Gemini 3 achieved 0.7. Selecting the judge model determines whether the entire system tracks human judgment or drifts from it.
    • Human judgment remains essential at the margins. When total scores differ by less than a point — as with GPT-5 (23.37) vs. Creative Brain (22.92) — the agent surfaces meaningfully different trade-offs that scores alone cannot resolve. The system’s value is in ensuring the right ideas and evidence reach the table, not replacing human judgment.
    • Evaluator reliability is a measured property, not an assumption. Across repeated independent runs on the same ideas, scores held stable with low standard deviation. This repeatability is what allows every other finding to be treated as signal rather than noise.

    Conclusion & impact

    This work demonstrates that scalable, repeatable creative evaluation using LLMs is practical today, provided the system is built with the right scaffolding: calibrated judge models, few-shot anchoring, multi-dimensional scoring, and cross-model validation.

    In practice, the Creativity Evaluation Agent enables:

    • Faster iteration — stress-test dozens of creative directions in minutes rather than weeks, before committing production budgets.
    • Comparable benchmarking — evaluate models, prompting strategies, and agentic architectures on common ground with a shared, reproducible rubric.
    • Diagnosable feedback — learn not just that an idea underperformed, but where and why, with dimension-level scores and qualitative commentary that teams can act on immediately.
    • Creative governance — an auditable, explainable evaluation process that scales alongside the growing volume of AI-generated creative, giving organisations confidence and consistency as they adopt generative tools.

    Ready to explore the specifics? Read our full technical deep dive into the Creativity Evaluation Agent Pod for a closer look at our methodology.

    Disclaimer: This content was created with AI assistance. All research and conclusions are the work of WPP Research.

  • Creativity evaluation pod: Technical walkthrough

    Creative ideas are the primary driver of advertising impact, yet evaluating them at scale remains stubbornly subjective — human panels are expensive, slow, inconsistent across evaluators, and impossible to run repeatedly as the volume of AI-generated concepts grows. The core problem is that creativity is multidimensional: a single aggregate score fails to capture whether an idea is original, strategically aligned, culturally resonant, or memorable, and without a shared, repeatable rubric, teams cannot meaningfully compare outputs across models, prompts, or campaigns. To address this, we built the Creativity Evaluation Agent, which scores marketing ideas in parallel across six established creativity frameworks — an Internal WPP, UOS, FFE, UUU, OSCAI, and Semiotics scores — using specialised Large Language Model (LLM) sub-agents with critic-refiner loops to ensure consistency, returning dimension-level scores alongside qualitative commentary in a single structured report. Calibrated against human expert ground truth, the system achieved a scoring error as low as 0.7 points (Gemini 3) with high repeatability on the internal WPP score framework (σ ≈ 0.21), and in a 210-match tournament across 14 global brands, it reliably differentiated creative quality between five frontier models — revealing that a specialised agentic creative system consistently outperformed vanilla LLMs given the same brief, giving marketing teams a fast, interpretable, and auditable way to benchmark and iterate on creative output before committing production resources.

    This document details the technical architecture, calibration methodology, and experimental design underlying the system built to address these gaps. For results and strategic findings, read our blog post instead.


    Problem statement and motivation

    Everyone agrees creativity matters in marketing. Nobody agrees on how to measure it. Put the same campaign idea in front of five reviewers and you’ll get five different scores. One loves the visual metaphor, another thinks the tagline falls flat, a third is just tired after reviewing thirty concepts before lunch. The scores reflect taste and circumstance as much as they reflect the work. This is fine when you’re picking between two finalist campaigns in a boardroom — it falls apart the moment you need to evaluate at scale. And scale is exactly what modern marketing demands. Teams are generating more ideas than ever, increasingly with the help of generative AI. They need to screen hundreds of concepts quickly, understand what specifically makes one idea stronger than another, and benchmark creative output across different models, prompts, teams, and time periods. A human review panel can do the first job slowly, the second job inconsistently, and the third job barely at all—while being expensive to convene every time. The core issues are straightforward:

    • Subjectivity — without a shared rubric, two reviewers scoring the same idea can land in completely different places.
    • Scalability — manual evaluation doesn’t survive contact with hundreds of ideas per sprint.
    • Feedback quality — a score without explanation is useless for iteration; explanations vary wildly across evaluators.
    • Cost and repeatability — assembling expert panels is slow and expensive, and running the same panel twice doesn’t guarantee the same results.

    What’s missing is a system that can apply structured, reproducible, explainable creativity assessment across large volumes of work — fast enough to be useful and consistent enough to be trusted.

    1. Introduction and solution overview

    Evaluating marketing creativity at scale demands more than a single score from a single judge. The Creativity Evaluation Agent, built on Google’s Agent Development Kit (ADK), extends the established LLM-as-a-Judge paradigm by introducing a multi-agent system in which specialised sub-agents score marketing ideas across six complementary creativity frameworks, each covering a distinct slice of what practitioners consider “good creativity.” Every scoring sub-agent is grounded through few-shot examples that teach the underlying LLM how the creative dimension it owns should be measured, narrowing the gap between automated and human judgement. The system accepts text, image, video, and PDF inputs, runs framework evaluations in parallel, and returns dimension-level scores together with qualitative commentary. It is accessible through both an API and a web UI.

    2. Technical approach

    2.1. Architecture overview

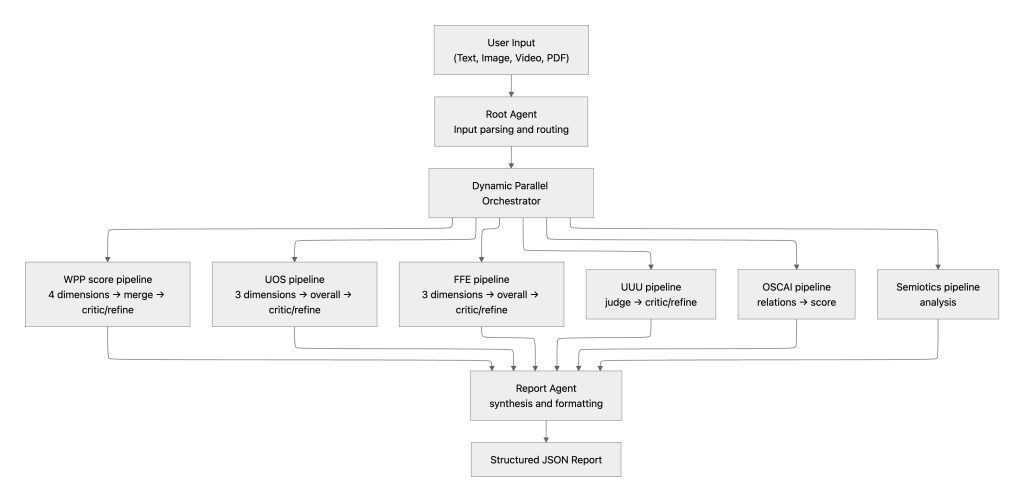
    At a high level, a user’s idea is received by a Root Agent, which parses the input and routes it to a Dynamic Parallel Orchestrator. The orchestrator spins up only the scoring pipelines the user has requested, runs them concurrently, and hands their outputs to a Report Agent that merges everything into a single structured JSON response.

    Figure 1: Architecture of the Creativity Evaluation Agent.

    2.2. Custom orchestration engine

    The core implementation is the Creativity Evaluation Agent, a custom ADK BaseAgent. Its behaviour breaks down as follows:

    • Root Agent. The user-facing entry point. It can answer questions, hold a conversation, and — when the user supplies a creative idea — forward it for evaluation. It decides which frameworks to invoke based on the user’s request.
    • Dynamic pipeline construction. Pipelines are not built ahead of time. Based on what the user asks for, the orchestrator assembles only the relevant evaluation chains, then executes them in parallel.
    • Critic–refiner loop. After initial scoring, each pipeline runs a bounded critic–refiner cycle (up to two iterations) in which a critic agent reviews the scores for obvious errors or inconsistencies. If the critic flags an issue, the refiner adjusts before the result is finalised.
    • Report Agent. Once all pipelines complete, this agent compiles dimension-level scores and qualitative commentary into a single, consistently formatted output. When the user has submitted multiple ideas, the report includes a comparative analysis.

    Each scoring pipeline is built around an LlmAgent instance initialised with a detailed system message encoding its evaluation lens, together with few-shot examples that anchor outputs close to human scoring behaviour. Scores are emitted as continuous values (e.g. 1.2, 3.7) rather than discrete integers, matching the granularity of the ground-truth datasets. The six pipelines are:

    • WPP Score Pipeline. Scores ideas against a proprietary WPP creativity framework built around four dimensions:
      • how sharply the idea frames the business challenge, not just the marketing opportunity
      • how boldly it challenges category convention and subverts clichés
      • how authentically the proposed solution fits the brand and resonates with the audience) and
      • the scale of measurable growth and emotional response it is designed to deliver
    • Each dimension is scored 1–3 points, composited into an index ranging 0–12. The framework was calibrated against real-world campaign performance across multiple brands and markets. Few-shot examples are drawn from WPP’s internal archive of historically scored campaigns.
    • Usefulness, Originality and Suprise (UOS) Pipeline. Evaluates the classic definition of divergent creative value through three dimensions: Usefulness (does it solve a real problem and align with the brief’s constraints?), Originality (does it approach the problem in a novel way?), and Surprise (does it deliver an unexpected twist that captures attention?). The three dimension scores are aggregated into an overall UOS score.
    • Fluency, Flexibility and Elaboration (FFE) Pipeline. Quantifies the “mental engine” behind the idea through three dimensions: Fluency (how many distinct, relevant ideas are presented), Flexibility (how many different conceptual categories are explored), and Elaboration (how richly detailed and refined the idea is). Grounded in creativity research literature and benchmarked against marketing creativity datasets. Few-shot examples are generated using Torrance-style divergent thinking tasks (see Section 4.1).
    • Unique, Unexpected and Unforgettable (UUU) Pipeline. Assesses brand longevity through the lens of a Creative Strategist: Unique (could only this idea deliver this message in this way?), Unexpected (does it subvert expectations and force re-evaluation?), and Unforgettable (does it create a defining moment that lives rent-free in the audience’s mind?). Each dimension is scored as a continuous value and averaged into an overall UUU score.
    • OSCAI Pipeline. A two-stage pipeline for measuring conceptual distance. First, a sub-agent extracts semantic relations from the idea (e.g., man → eats → apple). Those relations are sent to the OSCAI API, maintained by the framework’s original authors, which scores each relation’s originality — distinguishing mundane links (a chef cooks dinner) from highly original relationships (a clown teaches mathematics). The returned scores quantify the creative leap at the heart of the idea.
    • Semiotics Pipeline. Applies the Saussurean principles of sign systems to decode how meaning is constructed through cultural symbols. The sub-agent analyses Denotation (literal content), Connotation (implied meaning), Myth (cultural narratives reinforced or challenged), the Semiotic Relation (additive, contradictory, etc.), Risks or tensions, and produces a Semiotic Coherence Score (0–3). Unlike the other pipelines, no few-shot examples are used — evaluation relies on the model’s inherent understanding of semiotic theory.

    2.3. Score normalization

    The six frameworks operate on different native scales:

    FrameworkNative scoringRange
    WPP ScoreSum of 4 dimensions, each 0–30–12
    FFEAverage of 3 dimensions, each 0–30–3
    UOSAverage of 3 dimensions, each 0–50–5
    UUUAverage of 3 dimensions, each 0–50–5
    OSCAISingle score0–5
    SemioticsCoherence score0–3

    Table 1: Creativity scores and their range. Direct comparison or summation across frameworks is misleading without normalisation. The following procedure is applied:

    1. Convert sums to averages. The WPP Score (a sum of four 0–3 dimensions) is divided by 4 to produce a 0–3 average, making it structurally comparable to other averaged scores.
    1. Rescale to a common 0–10 range. Each framework’s score is divided by its native maximum and multiplied by 10: normalised_score = (raw_score / max_score) × 10
    1. Composite total. The 4 normalised pillar scores (WPP, FFE, UOS, UUU) are summed into a composite total with a maximum of 40, each pillar contributing equally.

    OSCAI and Semiotics are reported as standalone scores and are not included in the composite total. This decision was made because OSCAI depends on an external API with different reliability characteristics, and both OSCAI and Semiotics showed higher inter-run variability (σ ≈ 0.80, see Section 4.3), which would add noise to the composite.

    2.4. Infrastructure and deployment

    ConcernTechnology
    Multi-agent orchestrationADK
    ComputeGoogle Cloud Run
    LLM inferenceVertex AI — Gemini 3 Pro as the primary judge model
    ObservabilityCloud Logging + Cloud Trace
    Container registryArtifact Registry
    Agent-to-agent protocolA2A

    Table 2: Employed Google teck stack.

    3. Ground truth data and system evaluation

    3.1 Dataset overview

    Reliable automated scoring requires credible ground truth. Because no single public dataset covers all six frameworks, a combination of historical data and synthetically generated ground truth was used.

    3.2. WPP score — historical human judgements

    The ground-truth dataset comes from WPP’s internal archive of marketing campaign ideas submitted between 2020 and 2023. Creative professionals scored each idea across the WPP dimensions. From this corpus, 6 scored ideas were selected as few-shot examples for the scoring sub-agent and 10 additional ideas were reserved for its critic agent.

    3.3. FFE — synthetic data via Torrance-style tasks

    Few-shot examples for the FFE framework were generated using Gemini prompted with tasks modelled on the Torrance Tests of Creative Thinking. Each example pairs a divergent-thinking task, a response, a score, and a justification. For instance:

    Example 1 (Score 0):

    • Task: Please list unusual uses of a plastic bottle.
    • Response: 1. Plant a seed in it. 2. Use it to water plants by poking holes. 3. Cut it in half to make a small planter. 4. Use it to store extra fertiliser.
    • Justification: All ideas fall under a single, narrow category (Gardening / Horticulture). No conceptual shift is demonstrated.

    3.4. UOS & UUU — community-sourced creative writing

    No pre-existing ground truth was available for these two frameworks, so it was constructed in three steps:

    1. Source corpus. The Creative Storytelling dataset (stories from r/WritingPrompts on Hugging Face) was used as raw material.
    1. Quality stratification. Stories were sorted by upvotes; 11 highly upvoted and 11 low-voted examples were selected to represent the ends of the quality spectrum.
    1. Automated annotation. These 22 stories, together with the formal definitions of the UOS and UUU dimensions, were fed to Gemini, which produced scored examples that serve as the few-shot ground truth for both frameworks.

    3.5. Scoring format

    All scoring sub-agents output continuous values (e.g. 1.2, 2.8) rather than rounding to integers. This decision was made to stay consistent with the WPP ground-truth scores, which are themselves continuous, and to preserve finer-grained distinctions between ideas.

    3.6. Variability analysis

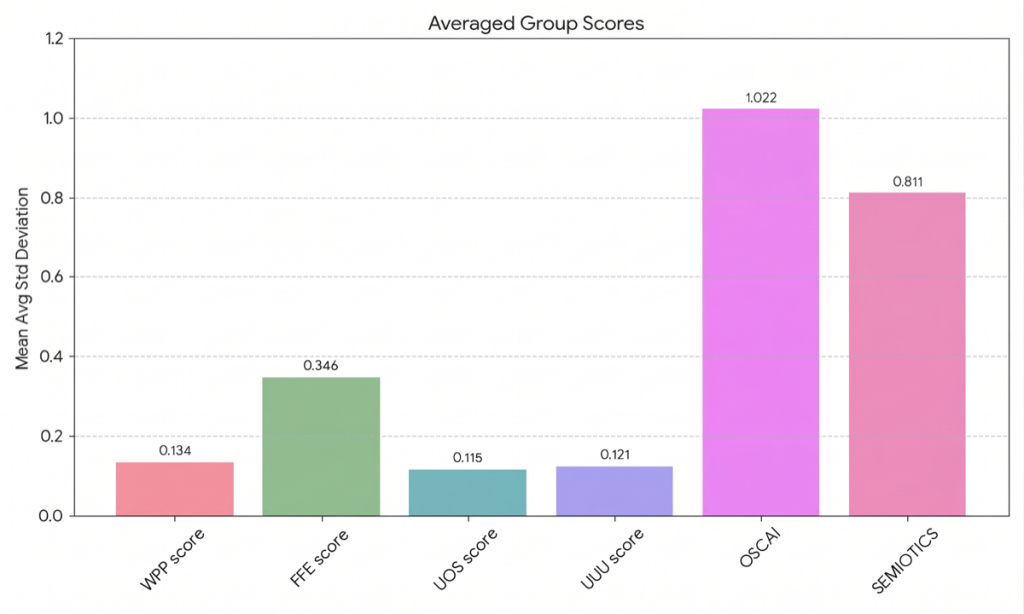
    Reliability was assessed by scoring 55 campaign ideas (one per model) for a popular beverage brand, three times each. Each of the 5 ideas (one per AI model) was rated 3 times by the benchmark agent, and the standard deviation (std) across those 3 runs was computed per score. Each bar shows the average std across all 5 models, so taller bars mean the agent scores that dimension less consistently.

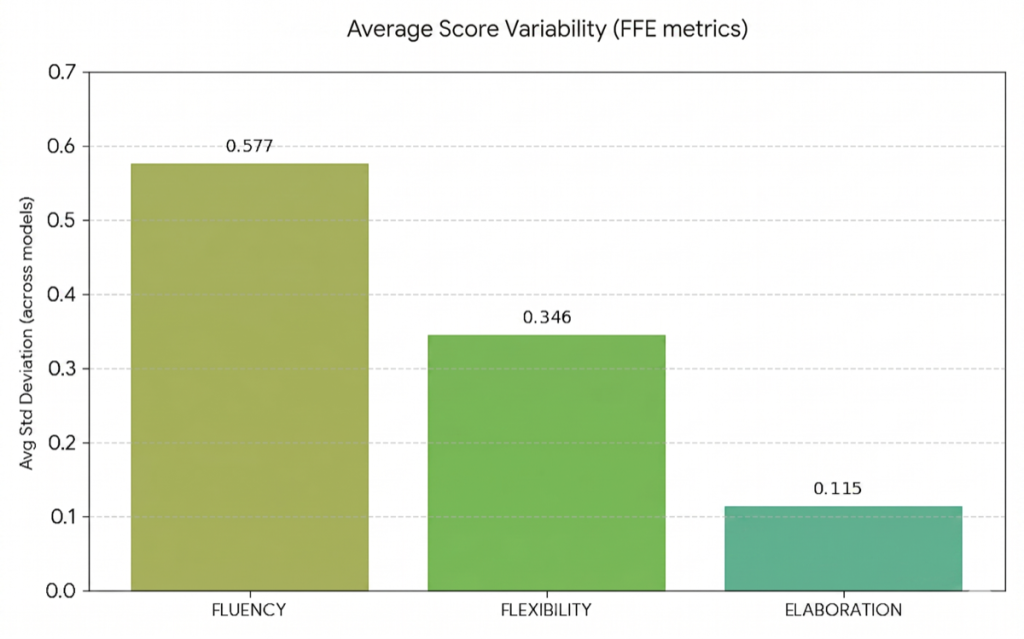
    • FFE (Fluency, Flexibility and Elaboration) score shows moderate variability with average std ~ 0.3. Further examination of each constituent creativity aspect evaluated by the FFE score, showed that the deviation is skewed because of Fluency’s variance. This can be due to how Fluency is defined, which is “Evaluate how many distinct, relevant ideas or solutions are presented. Count only meaningful and contextually appropriate ones (avoid repetition or vague statements).” — an inherently count-based metric where the boundary between “distinct” and “overlapping” ideas introduces subjective judgment for an LLM.
    • OSCAI & Semiotics show moderate variability with average std ~0.8, which directly motivated their exclusion from the composite tournament score.
    Figure 2: Average Score Variability of each scoring sub agent.
    Figure 3: Score variability for the Fluency, Flexibility and Elaboration aspects that the FFE score measures.

    4. LLM evaluation tournament

    Full tournament results and key findings are covered in the blog post. This section documents the experimental design, technical implementation, per-framework results, and supplementary analysis.

    4.1 Experimental design

    Players.

    PlayerDescription
    GPT-5Standalone, standardised prompt
    Gemini 3Standalone, standardised prompt
    Gemini 2.5Standalone, standardised prompt
    Claude Sonnet 4.5Standalone, standardised prompt
    Creative BrainWPP’s multi-agent ideation system, built on Gemini 3

    Table 3: The LLMs that took part in the evaluation tournament. Prompt design. Four standalone models received a standardised, neutral prompt to ensure a level playing field:

    “Give me a creative marketing idea/campaign based on the brief. Your output must have a title and three sections: Challenge, Core Idea, and Execution.”

    The Creative Brain received the same brief but processed it through its own multi-agent ideation pipeline — testing whether agentic orchestration outperforms raw model capability given identical inputs. Briefs. Each model generated ideas for 14 global brands spanning different categories and creative challenges. Iterations. Each model–brand combination was run 3 times, producing independent idea generations to account for output variance.

    4.2. Implementation details

    Scoring. Gemini 3 was selected as the LLM that powered our scoring sub-agents. Rather than relying on side-by-side LLM comparisons (which can be inconsistent), the Creativity Evaluation Agent judged every idea independently, generating a structured creativity report with raw scores across all frameworks. This independent-scoring approach means each idea has a self-contained evaluation record that can be compared post hoc, eliminating ordering effects that plague pairwise LLM judging. Match simulation. An orchestration engine simulated head-to-head matches by computing the normalised score average across all evaluated frameworks for each idea on the same brief. Normalisation was applied per-framework to prevent any single framework from dominating (e.g., WPP scores range 0–12 while UUU averages range 1–5). For each brief, every pair of models was matched: the model with the higher normalised average won the match, the other lost. Draws were not permitted; in the event of an exact tie on normalised average, the match was recorded as a draw in Glicko-2 (outcome = 0.5). Glicko-2 parameters.

    ParameterValueRationale
    Initial rating (μ₀)1500Standard Glicko-2 default
    Initial rating deviation (RD₀)350Standard Glicko-2 default; reflects maximum uncertainty
    System volatility (σ)0.06Standard default; controls expected rating fluctuation per period
    Convergence tolerance (τ)0.000001For the iterative volatility update step

    Table 4: Glicko-2 parameter initialisation. Ratings were updated after each complete round-robin cycle across all 14 briefs before proceeding to the next iteration. This means each “rating period” contained C(5,2) × 14 = 140 matches (every pair of 5 models on every brief), and three rating periods were processed in sequence for the three iterations. Scale. Total matches: 3 iterations × 10 pairs × 14 briefs × (1 match per pair-brief) = 210 unique creative matches across the tournament per ranking method. For per-framework rankings, the same 210-match structure was applied but using the single-framework score (normalised) rather than the cross-framework composite.

    4.3 Per-framework leaderboards

    To understand where each model’s strengths and weaknesses lie, the same Glicko-2 tournament was run using each individual evaluation framework’s scores as the match-outcome criterion. The results reveal meaningfully different competitive profiles across creative dimensions. We omit the WPP and the aggregate Elo scores since they are available in the executive summary. Additionally we omit the Semiotics and OSCAI Elo scores due to their high scoring variance.

    4.3.1 FFE (Fluency, Flexibility, Elaboration)

    RankPlayerRatingRD
    🥇GPT-5189588.4
    🥈Creative Brain (Gemini 3)165171.8
    🥉Claude Sonnet 4.5158372.2
    4Gemini 3135877.8
    5Gemini 2.5128574.1

    Table 5: Elo ratings on FFE score. GPT-5 leads comfortably on FFE metrics. The gap between Creative Brain and Claude Sonnet 4.5 is narrow (~68 points), suggesting comparable idea elaboration depth. All Rating deviation (RD) values are below 89, indicating stable ratings.

    4.3.2 UOS (Uniqueness, Originality, Surprise)

    RankPlayerRatingRD
    🥇Creative Brain (Gemini 3)200695.5
    🥈GPT-5165783.6
    🥉Gemini 3156781.7
    4Claude Sonnet 4.5128384.7
    5Gemini 2.51009129.0

    Table 6: Elo ratings on UOS score. Creative Brain dominates originality, with a 349-point lead over GPT-5 — the widest gap between the top two players in any framework. Notably, standalone Gemini 3 ranks 3rd here (above Claude Sonnet 4.5), suggesting the base model has latent originality that Creative Brain’s orchestration amplifies dramatically. Gemini 2.5’s elevated RD (129.0) indicates volatile originality performance.

    4.3.3 UUU (Unexpected, Useful, Ultra-specific)

    RankPlayerRatingRD
    🥇Creative Brain (Gemini 3)2028107.5
    🥈GPT-5165382.8
    🥉Gemini 3144179.0
    4Claude Sonnet 4.5137778.2
    5Gemini 2.5958100.2

    Table 7: Elo ratings on UUU score. Creative Brain achieves its highest absolute rating (2028) on UUU — a 375-point lead over GPT-5. This framework rewards ideas that are simultaneously surprising and actionable, which aligns with the multi-agent pipeline’s design goal: push for unexpected angles while grounding them in executable detail. Creative Brain’s slightly elevated RD (107.5) suggests occasional variance, but the margin is decisive.

    4.4 Cross-framework analysis

    The per-framework breakdowns reveal distinct competitive profiles:

    PlayerFFEUOSUUUWPP score
    Creative Brain1651 (2nd)2006 (1st)2028 (1st)1889 (1st)
    GPT-51895 (1st)1657 (2nd)1653 (2nd)1858 (2nd)
    Claude Sonnet 4.51583 (3rd)1283 (4th)1377 (4th)1529 (3rd)
    Gemini 31358 (4th)1567 (3rd)1441 (3rd)1169 (4th)
    Gemini 2.51285 (5th)1009 (5th)958 (5th)962 (5th)

    Table 8: Aggregate Elo ratings. Key patterns:

    • Creative Brain’s advantage is most scores. It ranks 1st on UOS, UUU, and WPP score while it drops to 2nd on FFE.
    • GPT-5 is the second best when it comes to creativity. It ranks 1st or 2nd on every single framework. Its weakest showing is 2nd place on UOS, UUU and WPP score, behind Creative Brain.
    • Claude Sonnet 4.5 has a spiked profile. Competitive on FFE (3rd, close to Creative Brain), but drops to 4th on UOS and UUU. This suggests its outputs are well-elaborated but less likely to produce unexpected or surprising creative leaps.
    • Gemini 3 benefits substantially from the complex orchestration that Creative Brain introduces. Across every framework, Creative Brain outperforms standalone Gemini 3 — the smallest gap is ~293 points (FFE) and the largest is ~720 points (WPP score).

    4.5 Rating deviation & confidence

    Rating deviation (RD) indicates how confident the system is in each player’s rating — lower RD means more predictable performance and a more stable estimate.

    PlayerAvg RDMin RDMax RD
    Creative Brain89.971.8 (FFE)107.5 (UUU)
    GPT-586.882.8 (UUU)92.3 (WPP)
    Claude Sonnet 4.579.872.2 (FFE)84.7 (UOS)
    Gemini 382.377.8 (FFE)90.7 (WPP)
    Gemini 2.5101.974.1 (FFE)129.0 (UOS)

    Table 9: Mean RD of the LLM players across FFE, UOS, UUU and WPP score ratings. All top-three players converged to RD values below 96 on every framework (with the exception of Creative Brain’s 107.5 on UUU). Gemini 2.5’s RD reaches 129.0 on UOS, indicating that its originality performance is especially unpredictable — consistent with its higher error rate observed during calibration (Section 4.1.1). Claude Sonnet 4.5 has the lowest average RD (79.8), meaning its performance is the most predictable of all players — it reliably delivers a certain quality level even if that ceiling is lower than GPT-5 or Creative Brain on some dimensions.

    4.6 Limitations

    • Judge model bias. All evaluations were performed using a single LLM as the judge in each scoring sub-agent. While calibrated against human ground truth, any systematic blind spots in the underlying LLM could advantage or disadvantage specific players. Future work should include multi-judge ensembles.
    • Prompt parity vs. system parity. Creative Brain receives the same brief as other players but processes it through a multi-agent pipeline — it does more inference work per idea. The tournament tests system-level creative output, not cost-normalised or latency-normalised performance.
    • Framework coverage. Semiotics and OSCAI were excluded from per-framework Elo analysis due to high scoring variance (Section 4.3).
    • Brief diversity. 14 briefs span a meaningful range of categories but may not cover all creative challenge types (e.g. non-English markets).
    • Three iterations. While sufficient for Glicko-2 convergence to low RD in most cases, additional iterations would further tighten confidence intervals.

    5. Conclusions

    The Creativity Evaluation Agent is deployed and usable via UI and API, and it produces reliable results. The multi-framework approach improves coverage and gives more actionable feedback than a single aggregate score. The path forward includes continued validation against broader and more diverse human panels, expansion of the tournament to track how model capabilities evolve across releases, and integration of the evaluation agent directly into creative workflows — not as a post-hoc judge, but as a real-time collaborator that scores, critiques, and refines ideas within the generation loop itself.

  • Meet Your New Agentic Data Guardian

    1. The high cost of “dirty” data

    In the modern enterprise, data is the raw ingredient behind every strategic decision. Think of it like a premier restaurant: the Data Engineer is the sous-chef, meticulously sourcing and preparing ingredients, while the Data Scientist is the executive chef, transforming them into the predictive models and insights that drive the business forward. If the ingredients are spoiled or mislabelled, the final dish fails, no matter how talented the chef.

    Across several of our AI initiatives at WPP, we uncovered a pattern that was quietly draining velocity from our most ambitious projects. Our “sous-chefs”, skilled data engineers responsible for pipeline integrity, were spending up to one full day per week on tedious, largely manual Quality Assurance (QA) of data flowing into BigQuery. Row by row, column by column, they checked for missing values, logical contradictions, and phantom duplicates, work that was essential but deeply repetitive.

    This wasn’t just an inconvenience. It was a strategic bottleneck: it slowed the delivery of every downstream AI application, consumed senior engineering talent on janitorial tasks, and most dangerously created risk. When a human eye is the only safeguard between raw data and a production model, errors don’t just slip through occasionally. They slip through systematically, at exactly the moments when the data is most complex and the engineer is most fatigued.

    We asked ourselves a different question: What if, instead of building another dashboard or writing another validation script, we built an intelligent agent, one that could reason about data quality the way an experienced engineer does, learn from every audit it performs, and get better over time?

    This article describes how we built that agent, what makes it fundamentally different from traditional automation, and what happened when we put it to the test.

    You can also explore the open-source codebase, built end-to-end with the Google AI stack: https://github.com/WPPResearch/x-wppopen-researchlab_wpp_data_quality_assurance_agent


    2. The problem: why data quality demands more than scripts

    The data & the modelling ecosystem

    The agent operates on digital marketing campaign performance data hosted in BigQuery, massive tables that track how advertising campaigns perform on a daily basis across major ad networks like Meta (Facebook and Instagram). Each row represents a highly granular intersection of a specific campaign, audience segment, platform, device, and creative asset. This data captures everything from broad identifiers (like the parent brand and geographical targeting) down to precise performance metrics, including impressions, clicks, daily spend, conversions, leads, and app installs.

    This foundational data is the lifeblood of two critical machine learning systems:

    1. The Prediction Model: A classification system designed to predict whether a planned campaign will yield a negative, neutral, or positive outcome.
    2. The Recommendation System: A highly flexible advisory engine capable of handling any combination of “missing modalities.” For example, if a media planner inputs a specific Brand, Target Audience, and Location, the system dynamically recommends the optimal missing parameters, such as the best platform to use and the most effective creative asset to deploy.

    For more background on the broader modelling context, see From Guesswork to Glimpse: How AI is Predicting the Future of Marketing Campaigns.

    The silent threat of data corruption

    Because these models directly inform real-world media spend and strategic campaign planning, their accuracy is paramount. The underlying data is regularly refreshed directly from the advertising platforms to keep the models up to date. However, this automated refresh process frequently introduces subtle corruption and systemic inconsistencies.

    For instance, while metrics like engagement and clicks generally remain stable, downstream pipeline issues frequently render conversions and awareness metrics unreliable (“not high quality”). At the individual row level, these anomalies are often entirely invisible. But at scale, they are devastating. If left unchecked, these untrustworthy data points bleed into the training sets, silently degrading the prediction model’s accuracy and causing the recommendation engine to suggest sub-optimal, expensive campaign configurations. This makes rigorous, automated data quality validation not just a nice-to-have, but an absolute necessity for the ecosystem to function.

    The failure modes

    The scale and velocity of data flowing into BigQuery mean that errors don’t announce themselves. They hide. Through our manual QA process, we catalogued six prevalent failure modes, each one capable of silently degrading every model built on top of the data:

    Failure ModeWhat HappensWhy It Matters
    Missing ValuesFields arrive empty: sometimes 5% of a column, sometimes 40%Models trained on incomplete data learn incomplete patterns. Forecasts drift silently.
    OutliersA metric reads 200,000 clicks when the true value is 500A single extreme value can skew an entire model’s calibration, distorting spend recommendations.
    Duplicate RowsIdentical records appear multiple timesInflated counts cascade into inflated budgets. Campaigns appear to outperform reality.
    Categorical CorruptionA brand name like "Nike" is replaced with "zX9pQ"Segmentation breaks. Reports attribute performance to entities that don’t exist.
    Logical InconsistenciesMore clicks than impressions. Spend recorded against zero impressions.These are the most insidious. Each value looks valid in isolation, but the relationships between them violate business reality.
    Missing ColumnsAn entire field disappears from a refreshDownstream pipelines fail or, worse, silently fall back to defaults.

    A static validation script can catch some of these: the easy ones, the ones you’ve already seen. But scripts are brittle: they encode yesterday’s assumptions and break on tomorrow’s edge case. They cannot reason about why a pattern looks wrong, weigh it against historical context, or decide whether a recurring anomaly is a genuine error or a known artifact of a data source.

    That requires judgment. And judgment is what we built the agent to provide.


    3. Our approach: an agent that reasons, remembers, and improves

    We designed the Data Quality Assurance Agent as a reasoning entity capable of planning an audit strategy, querying data, forming hypotheses about its health, testing those hypotheses, and learning from the results. The distinction matters. A script checks what you tell it to check. An agent decides what to check, based on what it knows and it has the tools to act on that decision end-to-end.

    Architecture: one agent, specialised tools

    The agent is powered by a single reasoning core that plans, decides, and acts. What gives it breadth is its toolkit, a set of specialised capabilities it can invoke as needed, selecting the right tool for each step of the audit:

    Data Agent Architecture Diagram
    • Database Tool: enables the agent to query BigQuery directly, fetching schemas, row counts, column statistics, and raw data samples.
    • Auditing Tool: the agent’s analytical engine. It formulates hypotheses about potential quality issues, runs targeted checks, and compiles structured findings. This tool reads from and writes to the Memory Bank.
    • Analytics Tool: generates visualisations using Python, including charts, distributions, and plots that make audit findings immediately legible to stakeholders.
    • Artifact Tool: packages the final audit report, charts, and evidence into downloadable artifacts stored in Google Cloud.

    The agent orchestrates these tools autonomously. When a user asks it to audit a table, the agent formulates a plan, queries the data, runs its checks, generates visualisations where useful, and compiles a structured report, all without the user needing to specify which tool to use or in what order.

    The key innovation: long-term memory

    Most AI tools are stateless. When the session ends, everything the system learned disappears. The next audit starts from zero. This is the fundamental limitation we set out to break. The agent maintains a persistent Memory Bank, a long-term knowledge store that survives across sessions and accumulates institutional intelligence over time. This memory captures three categories of knowledge:

    1. Historical Explanations When a data engineer confirms that a recurring anomaly is caused by a known tracking limitation or data source quirk, the agent records that explanation. The next time it encounters the same pattern, it doesn’t waste time flagging it as a new issue, it references the known cause, notes it in the report, and moves on to genuinely novel problems.
    2. Business Context Over successive audits, the agent absorbs the specific rhythms and patterns of our marketing data, seasonal spikes, platform-specific reporting delays, expected variance ranges for different campaign types. This contextual awareness allows it to distinguish between a real anomaly and normal business variation.
    3. Evolutionary Learning With every audit, the agent’s knowledge base deepens. Instead of repeating the same blind checks, it refines its hypotheses based on what it has seen before, including which columns tend to have issues, which tables are most prone to duplication, and which logical inconsistencies recur. The agent doesn’t just run. It compounds.

    This is what separates an agent from a script. A script executes the same logic every time, regardless of history. The agent carries forward everything it has learned and every audit it performs makes the next one sharper.

    The tech stack

    To ensure the agent was enterprise-grade, we built on the full Google Cloud AI ecosystem:

    ComponentRole
    Vertex AI Agent EngineManages the agent’s long-term specific memory persistence, and saving of the chat sessions
    BigQueryThe single source of truth where the agent performs direct, in-place auditing against production tables
    Agent Development Kit (ADK)The framework used to define the agent’s tools, constraints, and interaction boundaries
    Google Cloud StoragePersistent storage for audit trails, PDF reports, and visual evidence
    Cloud RunsUsed to deploy the A2A Agent API, and the ADK Web UI for demo purposes
    A2AThe protocol to expose our Agent as a headless API

    4. Proving it works: synthetic error injection

    We didn’t hope the agent worked. We proved it using a controlled methodology we call Synthetic Error Injection. The premise is straightforward: take a perfectly clean dataset, intentionally corrupt it in specific, measurable ways, and then challenge the agent to find every error we planted. If the agent can detect artificially injected errors, whose exact type, location, and severity we control, we can be confident it will handle real-world data corruption, which is typically far less extreme.

    Step 1: Preparing the test data

    Before injecting errors, we prepare the data for safe, controlled experimentation:

    • Anonymisation: Real brand and advertiser names are replaced with generic identifiers ("Brand 1", "Company A"). Sensitive business information never enters the test environment.
    • Corruption: The dataset then receives a different severity level of corruption. This allows us to map the agent’s detection accuracy as a function of error density, from subtle (5%) to extreme (40%).

    Step 2: Injecting controlled errors

    Using purpose-built scripts, we introduce precisely calibrated corruptions into a table, 4 types of Structural and 7 types of Logical errors:

    CategoryErrorDescription
    StructuralMissing Values (Nulls)X% of cells set to NULL
    StructuralDuplicate RowsX% exact row copies
    StructuralDropped ColumnsX% of columns removed
    StructuralCategorical ErrorsRandom alphanumeric strings in category fields
    LogicalClicks > ImpressionsCan’t click what wasn’t shown
    LogicalConversions > ClicksCan’t convert without clicking
    LogicalSpend with 0 ImpressionsPaying for zero ad delivery
    LogicalVideo Completions > PlaysCan’t finish without starting
    LogicalPurchases without Add-to-CartFunnel step skipped
    LogicalLanding Page Views > ClicksMore landings than clicks
    LogicalNegative Metric ValuesPerformance metrics can’t be negative

    Step 3: Synthetic ground truth dataset

    We keep track of the errors we introduce in a table and produce a ground truth dataset that looks like:

    Table_namenumber_of_injected_logical_errorstype_of_logical_errornumber_of_injected_structural_errorstype_of_structural_error
    table_010–1categorical errors
    table_020–1dropped columns
    table_031clicks_exceed_impressions0–
    table_041spend_with_zero_impressions0–

    5. 5. Evaluation pipeline, experiments and results

    To evaluate our Agent we follow the pipeline below:

    Evaluation pipeline flow diagram

    The 4 experiments and results

    Each experiment isolates a single variable to understand what affects the auditor agent’s detection quality.

    Experiment 1: Prompt comparison

    Question: Does giving the agent a more detailed prompt improve error detection?

    Runs the agent 3 times on the same table, each time with a different user query style:

    Prompt LevelWhat the user asksAgent’s system instruction
    Simple“Check if there are any errors for table X”Stays constant (forensic mode)
    Medium“Perform a structured assessment checking physical integrity, numerical sanity, categorical validity”Stays constant
    Complex“Conduct a forensic audit checking for 11 specific error types with detailed cross-column logical checks”Stays constant

    Key insight from results:  Only the complex prompt successfully detected the injected spend_with_zero_impressions error (139 rows, 1.82%), while both the simple and medium prompts missed it entirely, confirming that more detailed, forensic-style instructions are critical for the agent to test nuanced logical relationships rather than just surface-level checks.


    Experiment 2: Table sweep

    Question: How well does the agent detect different types of errors?

    Experiment 2 stress-tests the Auditor agent (using the complex prompt) on 11 synthetic BigQuery tables with progressively stacked error combinations, ranging from a single logical violation to the full set of 7 logical plus 4 structural error types (11 total). The agent achieved perfect detection on 8 of 11 tables (72.7% with F1 = 1.0) and delivered strong overall performance (precision 0.905, recall 0.864, F1 0.883).

    Experiment 3: Consistency check

    Question: If we run the exact same audit N times, do we get the same results?

    Runs the identical configuration multiple times (default: 3).

    The Consistency Experiment demonstrated that the auditor agent achieves perfect 100% reproducibility, consistently detecting both injected errors and real data quality issues with the exact same metrics and explanations across all three runs. This deterministic performance confirms that the agent’s complex prompt configuration is highly reliable effectively eliminating the need for redundant audits.


    Experiment 4: Memory ablation

    Question: Does loading past audit memories help the agent perform better?

    Runs the agent twice on the same table with the complex prompt:

    ConditionWhat happens
    No MemoryCold start; agent has no context from prior audits
    With MemoryAgent loads past findings from Vertex AI memory before auditing

    Key insight from results:  Memory doesn’t unlock new capabilities when tables contain simple structural errors or when the user prompt leads to a very detailed auditing but acts as a critical consistency enforcer, stabilising the audit scope to guarantee a 100% success rate. However, in cases that there are many different logical errors in a table and the prompt is simple, when past memories are loaded into the agent’s present context performance becomes optimal.


    6. The agent in action

    Below is an actual interaction with the deployed agent, demonstrating its reasoning in practice. The agent discovers available tables, loads its accumulated memory from prior audits, and then, guided by that memory, conducts a targeted audit.

    Discovery

    Human: “What tables do you have access to?”

    Agent: “I have access to the following tables in the dataset:

    • campaign_performance_table_1
    • campaign_performance_table_2
    • campaign_performance_table_3
    • campaign_performance_table_4
    • campaign_performance_table_5

    Memory recall

    Human: “Load your memories.”

    Agent: “I have loaded the following memories:

    1. A general instruction to always check for null values in tables.
    2. A specific data quality issue in campaign_performance_table_2 where 188 rows (18.8%) were duplicates based on event_date, campaign_id, and ad_creative_id.
    3. A preference for reports to be formatted in Markdown and include an executive summary.”

    The agent doesn’t start from scratch. It arrives with institutional knowledge: prior findings, user preferences, and standing instructions; all retrieved from its persistent Memory Bank.

    Hypothesis-driven audit

    Human: “Based on these memories, audit campaign_performance_table_3.”

    The agent formulates a plan, queries the table using its database tool, and, informed by its memories, produces a structured audit report:

    Executive Summary: This audit revealed a consistent pattern of missing values across key columns, affecting exactly 5% of total rows. Specifically, event_date, campaign_id, impressions, clicks, and conversions each had 50 null entries out of 1,000 rows. No exact duplicate rows were found. This suggests a systemic issue with data completeness rather than random omissions.

    The agent then provides detailed findings per column, quantifying impact, assessing severity, and recommending next steps, before offering to proceed with outlier detection, categorical validation, and logical consistency checks.

    Persistent learning

    Human: “Save the results for this table.”

    Agent: “The audit results have been saved to memory.”

    The next time the agent audits any table, it will carry forward what it learned here: the 5% missing-value pattern, the columns affected, the systemic nature of the issue. Every audit makes the next one faster, more targeted, and more informed.


    7. Impact and what comes next

    Operational impact

    The deployment of the Data Quality Assurance Agent has delivered measurable results:

    • Reclaimed engineering capacity. By automating the bulk of manual QA, data engineers have shifted from repetitive inspection work to higher-value activities.
    • Earlier error detection. Quality issues are now caught at the point of ingestion, before they propagate into downstream models. This “shift-left” approach reduces the blast radius of bad data from hours to minutes.
    • Higher model reliability. Marketing agents, analytics pipelines, and machine learning models now operate on data that has been systematically validated, reducing the risk of predictions and recommendations built on flawed foundations.

    The bigger picture

    This agent is more than a tool. It is a blueprint for autonomous data governance, a pattern that can be replicated across any data pipeline where quality, scale, and velocity collide.

    We are currently extending the agent along three axes:

    • Cross-table auditing: enabling the agent to detect inconsistencies across related datasets, not just within a single table. Many of the most damaging data quality issues manifest as contradictions between tables that individually look clean.
    • Event-driven execution: triggering the agent automatically whenever a BigQuery table is updated, transforming data quality monitoring from a scheduled chore into a continuous, always-on safeguard.
    • Adversarial stress-testing: today, our synthetic error injection is script-based and manually configured. We are building a dedicated adversarial agent whose sole purpose is to generate increasingly complex, realistic data corruptions, subtle logical contradictions, plausible-looking outliers, correlated missing-value patterns, specifically designed to challenge the QA agent’s detection capabilities. By putting one agent against the other in a continuous red-team / blue-team loop, both improve: the adversarial agent learns to craft harder-to-detect errors, and the QA agent learns to catch them, driving each other toward sharper, more robust performance over time.

    Together, these extensions move us toward a future where data quality monitoring is not a task that consumes an engineer’s day. It is a capability the agent handles continuously and intelligently, surfacing only the issues that require human judgment and decision-making.

    Ready to explore the specifics? Read our full technical deep dive into Data Quality Agent Pod for a closer look at our methodology.

    Disclaimer: This content was created with AI assistance. All research and conclusions are the work of the WPP AI Lab team.

  • Data Quality Agent Pod: Technical walkthrough

    Silent data corruption is a well-documented challenge across modern ML pipelines. Broken ingestion jobs, schema drift, logical inconsistencies: these issues rarely trigger alerts, and by the time they’re caught, downstream models may have already been learning from compromised data. We built an autonomous agent that audits data directly in BigQuery, runs forensic structural and logical checks with zero manual input, and , crucially, remembers. Its persistent memory architecture means every audit sharpens the next, elevating data quality from a routine operational task into a compounding strategic advantage. The results: F1 of 0.88, perfect detection on 73% of test scenarios, and 100% consistency across runs.

    For a high-level overview of this technical report please visit our corresponding non-technical blog post here. You can also explore the open-source codebase, built end-to-end with the Google AI stack: https://github.com/WPPResearch/x-wppopen-researchlab_wpp_data_quality_assurance_agent

    Data quality assurance agent technical walkthrough

    Introduction

    Data quality assurance (QA) is a critical bottleneck in modern data engineering pipelines. Engineers frequently dedicate a disproportionate amount of time to manually profiling, verifying, and debugging datasets before they are cleared for downstream consumption by data scientists to build machine learning models. This manual intervention is unscalable, computationally inefficient, and prone to human error, particularly when validating complex, cross-column business logic within wide tables. To address this infrastructure gap, we architected and deployed the Data Quality Assurance Agent. Operating directly against our Google BigQuery data warehouse, the agent can autonomously interpret schemas, execute targeted NL2SQL anomaly detection queries, and generate comprehensive diagnostic reports. An important feature of this agent is its long-term memory architecture, hosted via Vertex AI Agent Engine. By indexing and retrieving historical context across sessions, the agent dynamically suppresses established baseline anomalies and adapts its detection heuristics based on previous human-in-the-loop corrections. To validate the agent’s detection capabilities under controlled and reproducible conditions, we developed a synthetic data generation pipeline that injects known structural and logical anomalies at configurable rates into anonymised, marketing data. Evaluation was conducted across 3 experimental configurations, spanning three prompt complexity levels and two memory modes, with scoring fully automated via an LLM-as-a-Judge pipeline using Gemini as the evaluator. The agent achieved a peak detection rate of 0.883% across all injected error categories under forensic-level prompting.


    Agent architecture

    The solution is structured around a hierarchical multi-agent orchestration pattern, with a central Root Agent coordinating seven specialized sub-agents, as illustrated in the diagram below. The Root Agent functions as an LLM-powered intent classifier: it parses each incoming user request, decomposes compound instructions into an ordered execution plan, and dynamically routes sub-tasks to the appropriate specialist agent, without relying on hard-coded conditional routing logic. This design enables the system to handle chained, multi-step requests (e.g., “query the database and then plot the results”) by composing multiple sub-agents in sequence within a single session. The architecture was inspired by ADK’s official examples repo.

    Sub-agent inventory

    The system employs a multi-agent orchestration architecture where a primary Root Agent delegates tasks to specialized sub-agents based on user intent. All agents are powered by Gemini 2.5 Flash, optimised for complex multi-step reasoning, low inference latency, and cost efficiency under high request volume.

    Sub-AgentCore Responsibility
    Auditor AgentDrives autonomous data quality auditing by executing structural and logical checks against BigQuery, maintaining historical context via the Memory Bank.
    BigQuery AgentFacilitates Text-to-SQL (NL2SQL) translation, generating optimized queries and executing them directly against the data warehouse.
    Analytics AgentPerforms Advanced Data Analysis (NL2Py) by dynamically generating and executing Python code within a secure Vertex AI sandbox for statistical profiling and visualization.
    BQML AgentOrchestrates BigQuery ML workflows, including model training, batch inference, and model lifecycle management.
    Artifact AgentHandles session-scoped file management to save, retrieve, and list generated execution artifacts (images, CSVs, PDFs).
    Report Agent*Synthesizes audit findings into multi-format reports (Markdown, HTML, PDF, JSON) and manages artifact uploads to Google Cloud Storage.
    Comparison Agent*Executes schema-level and volume-level structural comparisons across discrete BigQuery tables.
    • Note: The Report and Comparison agents are fully implemented in the repository but are intentionally disconnected from the Root Agent’s execution chain in this evaluation instance.

    Key system capabilities

    1. Dynamic Intent Classification: The Root Agent accurately decomposes complex natural language requests, determines the optimal execution path, and dynamically invokes the correct sub-agent chain.
    1. NL2SQL Querying: The BigQuery Agent translates natural language into optimised SQL, executing it directly against the data warehouse to extract and analyze data without friction.
    1. NL2Py Analysis: The Analytics Agent dynamically generates and executes Python code within a secure Vertex AI Code Interpreter sandbox, enabling advanced statistical profiling, custom visualisations, and complex cross-dataset joins.
    1. Autonomous Data Auditing: The Auditor Agent runs a comprehensive suite of structural and logical validation checks against BigQuery datasets, producing structured, reproducible diagnostic reports.
    1. Stateful Memory Persistence: By querying a persistent Memory Bank, the Auditor contextualizes newly detected anomalies against historically resolved or suppressed issues, ensuring the agent learns and adapts from past executions.
    1. Multi-Format Report Compilation: The Report Agent synthesizes raw audit findings into polished, user-preferred output formats and automatically pushes the final artifacts to Google Cloud Storage for human review.

    Long-term memory bank

    The system’s persistent Memory Bank, hosted on Vertex AI Agent Engine, gives the auditor institutional knowledge across sessions, eliminating cold-start noise and adapting its behaviour to individual user preferences over time. The Memory Bank tracks two custom semantic categories:

    TopicExamples
    Data Quality IssuesMissing columns, inflated metric values, recurring table-level anomalies
    User Preferences“Always include an executive summary”; “Flag outliers beyond 3σ”

    How memory is saved

    Memory persistence is user-directed. The Auditor invokes the save_memory tool only when explicitly asked (e.g., “…and save these findings to memory”). The Vertex AI Agent Engine then asynchronously extracts clean semantic facts from the session, stripping noise and verbose phrasing, and indexes them against the user’s user_id scope. When a new lesson or correction occurs, the agent doesn’t just blindly append a new memory; instead, it actively scans for similar existing entries. If a related memory is found, the system updates and refines the existing rule rather than creating a duplicate. This deduplication process ensures the knowledge base remains clean, concise, and highly effective, preventing the auditor from getting overwhelmed by redundant information over time. Agent Engine also persists the full conversation session alongside the extracted facts, meaning the complete interaction history (including tool calls, SQL queries, and agent reasoning) is retained across runs. This gives the system two complementary layers of recall: structured fact memory (distilled semantic facts) and full session continuity (complete conversation history), both managed within a single Vertex AI service.

    How memory is loaded

    When a query includes a load instruction (e.g., “load memories then check table X”), the Auditor calls the ADK LoadMemoryTool, which runs a similarity search against the Memory Bank scoped to the current user_id. Retrieved facts are injected into the agent’s working context before analysis begins, enabling it to:

    • Suppress re-flagging of known, already-resolved issues
    • Apply user formatting preferences from the first response
    • Re-verify previously detected anomalies to check if they persist

    Technology stack

    ComponentTechnologyRole
    Agent FrameworkGoogle Agent Development Kit (ADK)Agent orchestration, tool binding, session management, and A2A protocol support
    LLM (Agents)Gemini 2.5 FlashPowers all sub-agents; chosen for low latency and strong instruction-following
    LLM (Judge)Gemini 2.5 FlashPowers the LLM-as-a-Judge evaluation pipeline; stronger reasoning for unbiased scoring
    Data WarehouseGoogle BigQueryPrimary data store; queried via NL2SQL by both the BigQuery and Auditor agents
    Code ExecutionVertex AI Code InterpreterSandboxed Python runtime for the Analytics Agent
    Long-Term MemoryVertex AI Agent EngineHosts the persistent Memory Bank; enables cross-session learning and recall
    Artifact StorageGoogle Cloud StoragePersistent store for generated reports, JSON profiles, and session artifacts
    DeploymentGoogle Cloud RunHosts both the A2A API backend and the interactive web UI as containerized services
    CI/CDBitbucket PipelinesAutomated build, Docker image push to Artifact Registry, and Cloud Run deployment on merge
    InteroperabilityA2A ProtocolOpen HTTP-based standard enabling external agents and services to discover and invoke the system programmatically

    Dataset synthesis

    Evaluating an autonomous auditing agent requires a controlled, reproducible ground truth, something that real-world production data cannot provide, since errors are unverified by definition. To solve this, we engineered a modular synthetic corruption pipeline that operates on proprietary synthetic datasets designed to mirror real-world marketing dynamics, and produces deterministically corrupted BigQuery tables accompanied by a complete ground truth registry for automated scoring.

    Source dataset

    To ensure robust and repeatable results, we start with proprietary synthetic datasets giving us complete control and clear visibility into the drivers of campaign performance. The source dataset is a digital marketing performance table comprising 7,618 rows and 87 feature columns. Each record represents a unique daily measurement at the intersection of a campaign, audience segment, delivery platform, ad placement, and creative asset. Columns are organised into six functional groups:

    Column GroupDescription
    Brand & AdvertiserIdentity of the brand and advertiser running the campaign
    Campaign & Media BuyCampaign IDs, names, and media buying hierarchy
    Geo TargetingGeographic targeting and exclusion rules (countries, regions, cities)
    Audience TargetingDemographic segments: gender, age group, generation, interests, and behaviors
    Delivery & PlatformCampaign objective, platform (Meta/Instagram), device type, and ad placement
    Performance MetricsFunnel KPIs: impressions, clicks, spend, conversions, video plays, video completions, landing page views, add-to-cart events, and purchases

    The Performance Metrics group is the most analytically significant: the columns encode a strict, real-world causal funnel (impressions → clicks → landing page views → add-to-cart → conversions/purchases) where each downstream metric is physically bounded by the upstream one. Violations of these relationships (for example, clicks > impressions) are logically impossible under normal operating conditions. This funnel structure forms the basis for all logical error injection. Additionally, the dual attribution windows (immediate vs. 7-day) introduce latent complexity: the complex prompt level successfully identified cross-window contradictions as an un-injected source of potential logical ambiguity.

    Corruption pipeline

    The pipeline is structured as a three-stage process. Anonymisation is performed first, followed by structural error injection, and concluding with logical error injection. These stages consist of composable modules that can be selectively enabled or combined to produce datasets with precisely controlled corruption profiles. The error rate is fully configurable per stage and can be held constant (for fixed-recall benchmarks) or varied progressively from 5 to 40% (to model the agent’s sensitivity as a function of corruption severity).

    Stage 1 — Anonymisation

    As a preprocessing step, the pipeline replaces PII and commercially sensitive fields (brand, campaign, creative) with generic identifiers (e.g., brand_1, campaign_1), while cleanly preserving all structural relationships.

    Stage 2 — Structural errors

    Structural anomalies target individual cells, columns, or rows, and are generally detectable through standard data profiling techniques. This stage consists of five independent injection modules:

    Error TypeSimulation / Injection Method
    Missing Values (Nulls)Injects NaN values across a configurable subset of columns to simulate missing or dropped data.
    OutliersReplaces numeric values with statistical extremes (mean ± k × std) to simulate sensor noise or ETL overflow.
    Duplicate RowsDuplicates randomly selected rows and re-inserts them at random positions to simulate pipeline idempotency failures.
    Categorical ErrorsReplaces valid categories with unique random alphanumeric strings (e.g., a3x7h9) guaranteed not to be in any valid vocabulary.
    Schema Drift (Col Drops)Randomly removes entire columns to simulate upstream data source failures.

    Stage 3 — Logical errors

    Logical errors are the hardest class of anomalies to detect. Every individual cell value is numerically valid; the violation only becomes apparent when two or more columns are evaluated relationally. This stage injects records that violate any of the following seven business rules:

    #Rule ViolatedCondition Injected
    1Clicks ≤ Impressionsclicks > impressions
    2Conversions ≤ Clicksconversions > clicks
    3Spend requires Impressionsspend > 0 AND impressions = 0
    4Video Completions ≤ Playsvideo_completions > video_plays
    5Purchases require Add-to-Cartpurchases > 0 AND add_to_cart = 0
    6Landing Page Views ≤ Clickslanding_page_views > clicks
    7Non-negative Metric ValuesNegative values injected into impressions, clicks, spend, or conversions

    Ground truth registry

    The evaluation framework is anchored by our ground truth dataset, a structured registry of all 59 BigQuery test tables used in the experiment suite. Each row maps a table’s BigQuery name to its complete injection specification:

    • the number of logical errors injected (out of a maximum of 7 possible rule types)
    • the exact error type labels (e.g., clicks_exceed_impressions, purchases_without_add_to_cart)
    • the number of structural errors injected (out of 4 possible types), and their corresponding labels (e.g., null values, outliers, duplicates, categorical errors)

    The registry covers two tiers of test tables: 48 single-error tables (examples 1–48), each containing one isolated error type at varying injection rates of 5%, 10%, 20%, and 40%, and 11 compound synthetic tables (examples 49–59) with progressively stacked errors, starting from a single logical violation and escalating to the maximum combination of all 7 logical and all 4 structural error types simultaneously.

    Table NameLogical ErrorsLogical Error TypesStructural ErrorsStructural Error Types
    ..._categorical_error_5_percent0—1 / 4categorical errors
    ..._logical_error_1_5_percent1 / 7clicks_exceed_impressions0—
    log_1_5_pt..._dup_5_pt_cat_5_pt7 / 7clicks_exceed_impressions, conversions_exceed_clicks, landing_page_views_exceed_clicks, negative_metric_values, purchases_without_add_to_cart, spend_with_zero_impressions, video_completions_exceed_plays4 / 4null values, outliers, duplicates, categorical errors

    Evaluation pipeline

    Rigorous evaluation of the auditor agent is essential to ensure it consistently and accurately identifies true data corruption without generating false positives. To accomplish this, the evaluation pipeline uses an automated, four-step process to continuously assess the agent’s performance. First, the pipeline utilises synthetic ground truth data stored in BigQuery tables, seeded with deliberate structural and logical errors (such as NULLs, duplicates, and business-rule violations). Second, the auditor agent is executed against these tables through multiple experimental setups, including prompt comparisons (simple vs. complex queries), table anomaly sweeps, and memory ablation studies (cold starts vs. loading past audits). During these runs, the agent uses its SQL tools to investigate the data and generates a comprehensive final audit report. Third, rather than relying on slow manual review, we automate the evaluation using an LLM-as-a-Judge approach. A separate Gemini Flash instance receives the agent’s full audit report alongside the complete ground truth registry. Acting as an expert evaluator, the judge compares the outputs and produces a structured scorecard with ✅/❌ verdicts and brief explanations for every error category. This eliminates subjective scoring bias and allows new prompt designs or memory configurations to be evaluated end-to-end in minutes. Finally, these scorecards are parsed to compute precision, recall, and F1 scores per error type, which are then exported to CSV for detailed analysis. This is also illustrated in the diagram below:

    ┌────────────────────────────────────────────────────────────────┐
    │                       EVALUATION PIPELINE                      │
    ├────────────────────────────────────────────────────────────────┤
    │ 1. Synthetic Data   │ Tables in BigQuery with injected errors: │
    │    (ground truth)   │ NULLs, duplicates, outliers, categorical │
    │                     │ errors, logical violations.              │
    │                     │                                          │
    │ 2. Run Auditor      │ 4 experiments test different factors:    │
    │    Agent            │  → Exp 1: Prompt Comparison              │
    │                     │  → Exp 2: Table Sweep                    │
    │                     │  → Exp 3: Memory Ablation                │
    │                     │ Agent uses tools to run SQL & produce an │
    │                     │ audit report per run.                    │
    │                     │                                          │
    │ 3. LLM-as-Judge     │ Gemini Flash compares agent report to    │
    │    (Gemini Flash)   │ ground truth.                            │
    │                     │  → Scores each error: ✅ detected / ❌   │
    │                     │                                          │
    │ 4. Metrics          │ Parse scorecards → compute precision,    │
    │    Generation       │ recall, F1 per error type.               │
    │                     │  → Save to CSV                           │
    └────────────────────────────────────────────────────────────────┘
    

    Experimental setup

    To rigorously validate the Auditor agent’s detection capabilities, we designed a suite of three complementary experiments, each isolating a different factor that influences audit performance:

    1. Experiment 1 — Prompt Comparison: Measures how the complexity and specificity of the user prompt affects the agent’s ability to detect both structural and logical errors, comparing a simple exploratory prompt against a medium-structured prompt and a forensic-level complex prompt.
    1. Experiment 2 — Table Sweep: Stress-tests the agent’s scalability and robustness by sweeping across 11 synthetic tables with progressively stacked error combinations, ranging from a single isolated violation to the maximum of 11 simultaneous error types. This maps the detection ceiling under the best-performing prompt.
    1. Experiment 3 — Memory Ablation: Isolates the contribution of the long-term Memory Bank by comparing a cold-start baseline (no prior context) against a memory-augmented run, quantifying how historical context from past audit sessions improves detection accuracy.

    Together, these experiments span the key dimensions of agent performance: prompt engineering, error complexity, and contextual memory, providing a comprehensive view of the system’s strengths and current limitations. All experiments use the same synthetic corruption pipeline and LLM-as-a-Judge scoring framework described above.

    Experiment 1: Prompt Comparison

    Our first research question was whether prompt specification (instructional structure, domain constraints, and required check set) is a first-order driver of audit performance, independent of the underlying dataset and injected corruption profile. In other words, does increasing prompt information content and enforcing explicit cross-column invariants improve the agent’s ability to surface structural anomalies and relational business-rule violations, and what is the marginal lift as we move from a zero-shot “health check” prompt to a forensic, hypothesis-driven audit prompt? To isolate this variable, we held the dataset and error profile constant, injecting known errors at a flat 5% rate per type into a table of anonymised marketing data, and varied only the prompt complexity across three levels:

    Prompt LevelDescription
    SimpleBasic health check: explore, verify, report
    MediumStructured assessment organized by data quality pillars
    ComplexForensic audit with cross-column hypothesis testing and business context

    Results

    To quantify the impact of prompt engineering, we measured the detection accuracy for each of the three prompt levels against our ground truth dataset. The table below summarizes the results:

    MetricSimple PromptMedium PromptComplex Prompt
    Structural errors detected3/43/44/4
    Logical errors detected1/73/74/7
    Total score4/11 (36%)6/11 (55%)8/11 (73%)

    The Simple Prompt (scoring 4 out of 11) successfully detected missing values, outliers, categorical errors, and negative metric values, but failed to detect duplicate rows and missed most cross-column logical violations. The Medium Prompt (scoring 6 out of 11) was a significant step up; it detected missing values, identified duplicate rows, and found categorical errors, while additionally detecting key funnel violations like clicks being greater than impressions and conversions being greater than clicks. The Complex Prompt (scoring 8 out of 11) was the strongest performer, achieving 100% on structural errors with forensic-level explanations. On logical errors, it detected negative metrics, two funnel violations, and video completion inconsistencies, and the Auditor also discovered un-injected errors beyond the seeded corruption, including data mapping flaws. Our key observations are as following:

    1. Prompt complexity directly impacts detection quality. Moving from simple to complex prompts increased total detection from 36% to 73%.
    1. Structural errors are easier to detect than logical errors. Even the simplest prompt found 75% of structural errors, while logical error detection ranged from 14% to 57%.
    1. The complex prompt exhibited emergent behaviour, discovering data quality issues beyond the injected errors, which validates the agent’s analytical depth. Specifically, it identified a many-to-one mapping flaw where a single campaign_id mapped to multiple campaign_names, and logical contradictions between 7-day and immediate conversion windows.
    1. Error analysis reveals specific failure modes. For the “Spend > 0 while Impressions = 0” error, the agent checked the inverse condition (“Impressions > 0 AND Spend = 0”), demonstrating that the agent’s logical reasoning was sound but directionally inverted. This suggests that targeted few-shot examples or tool-level guardrails could address remaining gaps.
    1. Certain error types remain challenging regardless of prompt level, particularly those requiring knowledge of the full marketing funnel (e.g., purchases without add-to-cart, landing page views vs. clicks). These represent areas for future improvement because evaluating complex logical anomalies requires a deep contextual understanding of domain-specific business rules. Providing this context, whether through a persistent memory system that stores historical performance baselines and funnel definitions, or via highly explicit user prompts that clearly map expected relationships, is essential for the agent to accurately validate these scenarios rather than relying on generic data logic.

    Experiment 2: Table sweep

    Having identified the complex prompt as the strongest performer, we next evaluated its scaling behaviour under increasing anomaly superposition: specifically, how detection performance (precision/recall trade-offs) degrades or saturates as the number of simultaneously injected error modes per table increases. While a single-error table primarily probes per-check sensitivity, production-like settings exhibit error co-occurrence and interaction effects (masking, confounding, and correlated rule violations) that can materially alter the agent’s search strategy, query budget, and false-positive propensity. To probe this, we ran the Auditor against 11 synthetic BigQuery tables with progressively stacked error combinations — from a single isolated logical violation up to the maximum of all 7 logical and all 4 structural error types simultaneously (11 errors total per table). All runs used the complex prompt level, allowing us to map the agent’s detection ceiling as the error landscape grows increasingly complex. Results: Per-table and Aggregate Metrics *(Legend: L = Logical errors, S = Structural errors)

    TableError ProfileExpectedTPFPFNF1 Score
    synthetic_1_log_error1L11001.000 ✅
    synthetic_2_log_errors2L22600.400 ⚠️
    synthetic_3_log_errors3L30030.000 ❌
    synthetic_4_log_errors4L44001.000 ✅
    synthetic_5_log_errors5L55001.000 ✅
    synthetic_6_log_errors6L66001.000 ✅
    synthetic_7_log_errors7L77001.000 ✅
    synthetic_7_log_1_struct7L+1S82060.400 ⚠️
    synthetic_7_log_2_struct7L+2S99001.000 ✅
    synthetic_7_log_3_struct7L+3S1010001.000 ✅
    synthetic_7_log_4_struct7L+4S1111001.000 ✅
    MetricValue
    Perfect Detection (F1 = 1.0)8 / 11 tables (72.7%)
    Total True Positives (TP)57
    Total False Positives (FP)6
    Total False Negatives (FN)9
    Overall Precision57 / 63 = 0.905
    Overall Recall57 / 66 = 0.864
    Overall F1 Score0.883

    We also tested the auditor agent’s baseline ability to detect the same logical error at different prevalence levels (5%, 10%, 20%, and 40%). The agent successfully detected and accurately quantified the discrepancy at the 5%, 10%, 20% and 40% rates, demonstrating robust, range-agnostic capability that catches both rare edge cases and widespread corruption equally well. Ultimately, the results indicate that error rate prevalence does not significantly impact the agent’s detection performance when the audit completes successfully. Finally, we ran the identical configuration three times for one table as a consistency check, and observed perfect reproducibility: the auditor consistently detected both injected errors with the same metrics and explanations across all three runs. This deterministic behaviour indicates that the complex prompt configuration is stable, reducing the need for redundant audits.

    Experiment 3: Memory ablation

    The previous experiments characterized the agent’s single-session capability envelope under a fixed prompt specification. In a production setting, however, auditing is inherently iterative and longitudinal: the agent re-encounters the same schemas, recurring anomaly modes, and known “benign” deviations across repeated runs. This motivates a key question: does persistent, user-scoped memory (i.e., accumulated priors from prior audits) measurably improve detection performance and efficiency over time by biasing the agent toward higher-yield checks, reinstating domain-specific invariants without re-deriving them from scratch? To isolate the contribution of the long-term Memory Bank, we ran the agent twice on the same table under identical conditions, first with no prior context (cold start) and then with memories loaded from previous audit sessions. We evaluated the agent on a synthetic table (synthetic_7_log_4_struct) containing 7,999 rows, deliberately corrupted with 11 distinct error types (4 structural, 7 logical) at a ~5% error rate. The two conditions differed only in whether the agent had access to its Memory Bank before beginning the audit.

    Results

    Without memory, the agent received a minimalist zero-shot prompt (“Check if there are any errors for table X?”) and relied solely on exploratory analysis. Under these cold-start conditions, it achieved an overall detection rate of 45% (5/11), identifying 2 of 4 structural errors and 3 of 7 logical errors. When the same agent was instructed to load past context (“load memories about auditing tables…”), the results improved dramatically. By retrieving specific logical checks and known error patterns from prior sessions, the memory-augmented agent achieved a 91% detection rate (10/11), a 102% relative improvement over the baseline. Structural error detection reached a perfect 100% (4/4), while logical error detection rose from 43% to 86% (6/7), successfully uncovering complex violations such as negative metric values and spend recorded against zero impressions.

    The figure shows a clear performance gap between the memory-augmented agent (blue) and the baseline agent without memory (red). For structural errors, memory enabled perfect detection (100%) compared to 50% without memory. For logical errors, memory improved detection from 43% to 86%, demonstrating that access to prior audit patterns and domain knowledge substantially enhances the agent’s ability to identify complex data quality issues beyond basic exploratory analysis. The sole undetected error was a funnel sequence violation (purchases without add-to-cart). The agent did not miss this check due to a detection failure. It correctly reasoned that the validation was impossible given the aggregated schema, which lacked the transaction-level granularity required to verify a purchase-to-cart relationship. This suggests the miss was an analytically sound decision rather than a detection failure.

    Memory vs. prompt complexity

    These results raise an important nuance: if a prompt is already sufficiently detailed and structurally prescriptive (as in our complex prompt from Experiment 1), the memory module provides only marginal uplift. However, memory becomes highly valuable in continuous operational scenarios, where its benefits compound over time:

    • Adaptability: The agent iteratively learns from past edge cases, refining its checks with each audit cycle.
    • Contextual Awareness: It builds a deep, automated understanding of project-specific business rules and historically common data quality issues.
    • Consistency & Efficiency: Audit coverage remains stable across sessions, with fewer redundant exploratory queries needed to reach comprehensive detection.

    Cloud deployment

    The system is deployed as a production-grade, cloud-native service on Google Cloud, following a containerised, infrastructure-as-code workflow from local development through to automated CI/CD and managed compute.

    CI/CD pipeline

    The project uses a fully automated Bitbucket Pipelines CI/CD pipeline with two distinct execution stages:

    • On Pull Request: Automated linting and static analysis run immediately to enforce code quality standards before any merge is permitted.
    • On Merge to main: The pipeline builds two independent Docker images (one for the headless A2A API backend, one for the interactive web UI), pushes both to Google Artifact Registry, and triggers rolling deployments to their respective Cloud Run services. All runtime configuration (model identifiers, dataset IDs, memory service URIs, Cloud Storage bucket names) is injected exclusively via environment variables, ensuring no secrets or environment-specific values are hardcoded into the images.

    Dual-service deployment architecture

    The agent is deployed as two independent, containerised Cloud Run services, each built from its own Dockerfile and serving a distinct class of consumer:

    Service 1 — A2A API backend

    The backend service exposes a headless Agent-to-Agent (A2A) interface, an open, HTTP-based protocol designed for agent interoperability across frameworks. It publishes an Agent Card (a structured capability manifest) that allows any external service or AI agent to programmatically discover what the Data Quality Agent can do without requiring any knowledge of the underlying ADK implementation. Clients interact with the backend by sending structured JSON-RPC messages over standard HTTP. This means the auditor can be:

    • Integrated into classical data pipelines (like Airflow or dbt) to trigger automatic quality checks.
    • Orchestrated by other AI agents as part of a larger, automated workflow.
    • Invoked from any programming language, completely independent of the underlying Python stack.
    • Embedded in CI/CD or alerting systems using simple HTTP requests.

    Service 2 — Interactive Web UI

    The web UI service hosts an interactive conversational frontend, allowing data engineers and data scientists to interact directly with the full agent system through a browser. It communicates with the agent backend and provides a session-aware interface where users can issue audit requests, review structured findings, retrieve generated reports, and provide manual corrections that are subsequently persisted to the Memory Bank. Google Cloud Agent Engine provides shared, persistent session storage for both services, ensuring that conversation context and session state survive container restarts and instance scale-out events.


    Conclusion

    This report demonstrates a highly effective and intelligent agent for automating data quality assurance, utilizing a long-term memory architecture that not only frees up valuable engineering resources but also gets smarter with every interaction. By reclaiming data engineering bandwidth, it liberates engineers to focus on building infrastructure rather than performing manual data QA. It also catches errors in BigQuery tables before data scientists spend hours training models on corrupted data, shifting quality checks earlier in the pipeline. Ultimately, this compound intelligence ensures the system never resets; instead, every manual correction and interaction makes the auditor permanently better and more adapted to our data ecosystem.

    Lessons learned

    • Test with Synthetic Data First: Without a meticulously crafted synthetic dataset, we would have had no objective way to measure if our prompt strategies were improving the agent’s performance.
    • Memory is Context, Context is King: The ability to retrieve facts from past runs, including past errors, user feedback, and specific constraints, is what makes the difference between a stateless tool and an adaptive auditor.
    • Start Specific, Then Generalize: We focused on nailing the Auditor Agent’s specific use case with BigQuery first. This created a robust foundation before we expanded to other functions like report generation.
    • Leverage a Unified Cloud Ecosystem: Building entirely on Google Cloud services (ADK, Vertex AI, BigQuery, Cloud Run, Cloud Storage) eliminated integration friction between components and allowed us to move from prototype to production deployment without stitching together tools from multiple vendors.