Every year, brand-tracking programmes field hundreds of surveys: the same battery of questions, asked across audiences and categories, wave after wave. It is the backbone of how brands understand where they stand. It is also expensive, and a surprising amount of it tells you what you could already have worked out.
That last part is the interesting bit. In a new study using WPP’s Brand Asset® Valuator (BAV) data, we turned a familiar research question inside out. Instead of asking “how accurate can our tracking be?”, we asked the question a marketing or finance director would ask: “how few surveys can we run and still have data we are prepared to act on?” The answer, on the programme we tested, is about two-thirds of them. This post explains how we got there, what the trade-off looks like, and what it means for the way you plan fieldwork.
The expensive habit nobody questions
Brand tracking tends to treat every market the same. Point the same instrument at every audience and category, run it, then run it again next wave. The bill adds up fast. Published figures for professionally run surveys land around $17 per sampled person and $41 per completed questionnaire, rising to $110 per complete for some designs. These are US academic figures, but the economics travel, and they climb every year as response rates fall and each completed interview takes more effort to win.
There is a quality tax on top of the money. The more often and the longer you survey people, the more they rush, guess and drop out, so over-surveying can quietly erode the very accuracy it is meant to buy.
Meanwhile, markets are not equal in how much fresh measurement they need. Brand perceptions are sticky in some places and volatile in others. Some of your surveys move a lot between waves. Some barely move at all, and their results could have been predicted from the rest of the programme with useful precision. Treating both kinds the same means spending money where the answer was already in the archive.
The key insight: accuracy is a line you set, cost is what you cut
Here is the shift in thinking that makes the rest work.
Most conversations about predicting survey results get stuck on one question: “is the prediction accurate enough?” Asked that way, the answer is always “it could be better, at a price,” and the conversation goes nowhere.
We flipped it. The brand team decides in advance the lowest accuracy it is willing to act on. Call it the good-enough line. Then the job is to find the cheapest fieldwork programme that clears that line, and to predict everything else. Accuracy is not the thing you chase. It is a floor you refuse to go under. Cost is the thing you minimise.
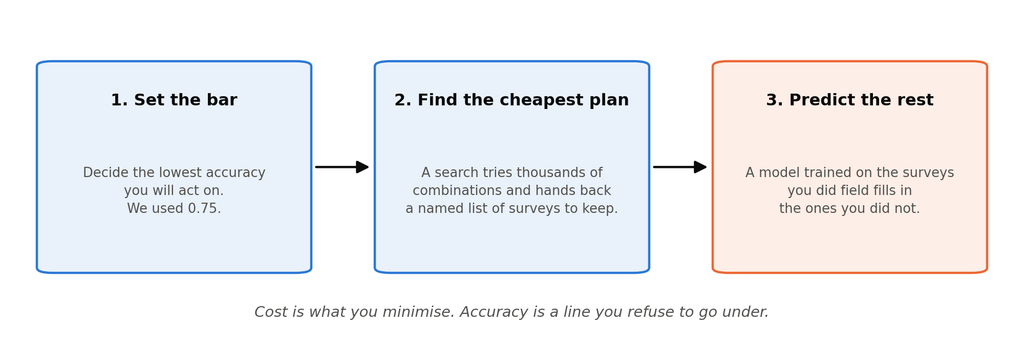
Figure 1: Set the bar, find the cheapest plan, and predict the rest.
Put that way, three moves follow naturally.
- Set the bar. For this study we set it at 0.75 on a standard accuracy measure (R², which runs from 0 for useless to 1 for perfect). That is a demonstration, not a recommendation. A tracker that feeds boardroom reviews can live with a lower bar than one that triggers spend market by market.
- Find the cheapest plan. A “survival of the fittest” search (a genetic algorithm) tries thousands of combinations of surveys and hands back a named list of the ones to keep fielding. Named matters. A percentage tells you how much to cut; a list tells you what.
- Predict the rest. A model trained on the surveys you did field fills in the ones you did not. Because every survey is described by the same handful of ingredients (audience, category, brand, attribute), the model learns how each ingredient shifts a brand’s scores and applies that to combinations it has never seen.
What each slice of budget buys you
The most useful thing the study produces is not a single number, it is a curve.
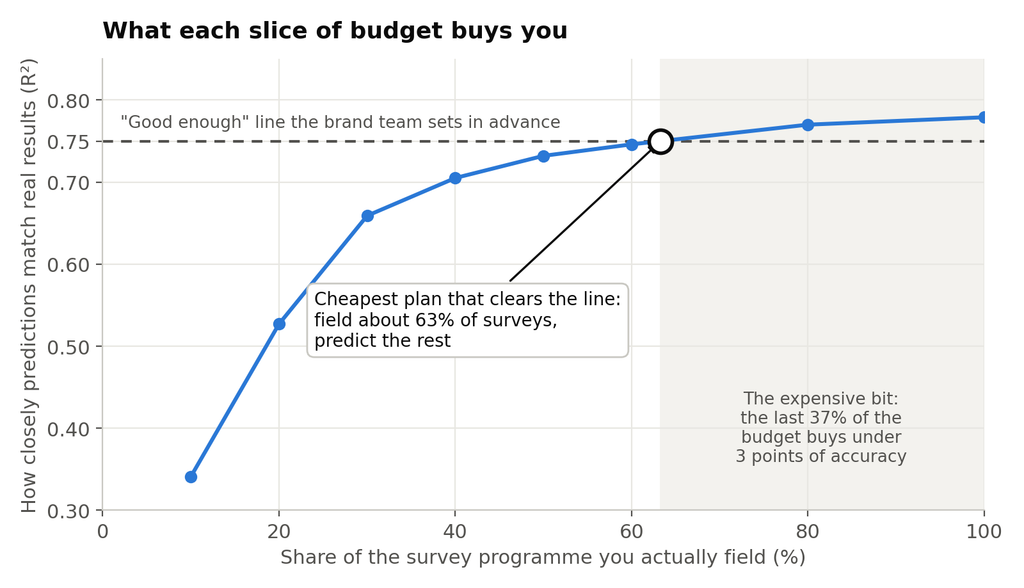
Figure 2: Prediction accuracy against the share of surveys fielded, showing the good-enough line at 0.75.
Read it left to right. Field 10% of your surveys and predictions are poor. Field 30% and they are already respectable. Field 60% and they are close to as good as they will ever get. After that, every extra survey buys less than the one before. On this programme, going from 63% of surveys to 100% of them lifts accuracy by under three points on a 100-point scale, and that final stretch is more than a third of the entire fieldwork budget.
This is the whole argument in one picture. The curve flattens, so the last few points of accuracy are the most expensive fieldwork you will ever buy. A programme that insists on the highest possible accuracy is paying its highest price for its smallest gain. Choosing to stop at the good-enough line is not a compromise on quality. It is the same logic you apply to every other budget you own.
The curve also lets you price any bar you like. Happy with 0.70? Field about 39% of the programme. Want 0.775? That will cost you about 91% of it. The conversation between research and finance can be had in one currency.
What we found
We tested this on the 2023 wave of BAV in the United States: 130 surveys (13 categories by 10 audiences), each scoring 10 brands on 46 attributes, nearly 60,000 data points in all. We held 26 surveys back as a hidden test set that the model never saw, so every accuracy figure below is on markets it had to predict cold.
- About a third of fieldwork is predictable. At the 0.75 bar, the cheapest plan fields roughly 63% of surveys and predicts the rest, a fieldwork reduction of about 37%. Fielding everything would reach only 0.78.
- The search returns a list, not just a number. On the training pool of 104 surveys, the genetic algorithm found a committable core of 81, a 22% reduction, with accuracy essentially unchanged (0.777 to 0.775). Being honest about this one: random selection can hit the bar with fewer surveys than the search found, because the search stops the moment it clears the line and does not keep pushing on cost. The search’s value is the named list you can act on, not a smaller number.
- The obvious shortcut does not work. We also tried filtering out the hardest-to-predict slices before compressing. On this data it made predictions worse at every threshold we tried. The model’s interaction features already capture what filtering would remove, so compression works at the level of whole surveys, which is also the level at which you actually buy fieldwork.
The trap: last year’s plan does not travel
Here is the finding that should change how you plan.
Take the surveys the search chose on 2023 and carry them, unchanged, into 2024 and 2025. Accuracy drops below the bar, to 0.73 and 0.69. Markets move, and a plan frozen on one wave goes stale on the next.
The fix is not to abandon the plan, it is to dilute it.
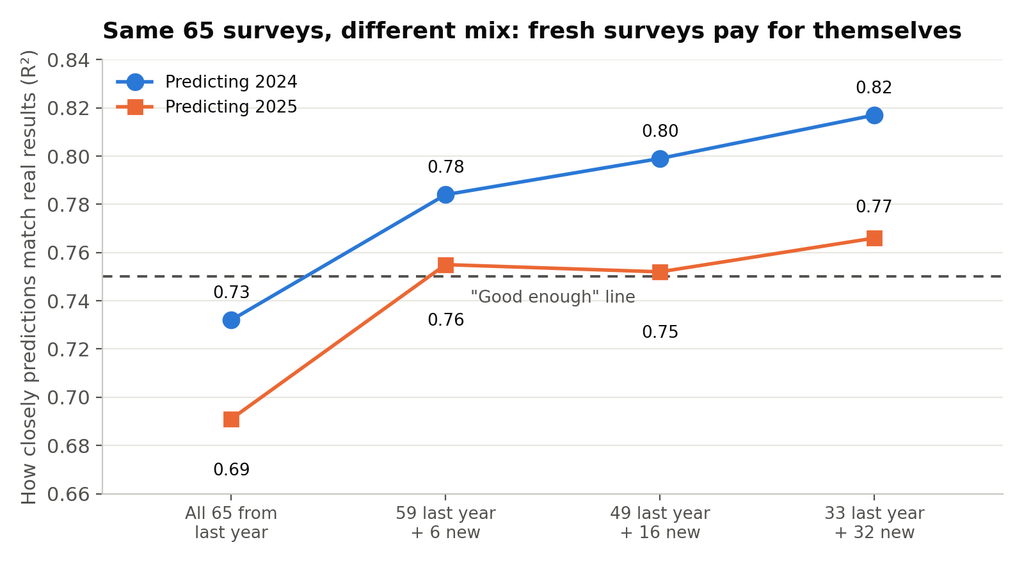
Figure 3: Accuracy rises as fresh surveys replace last year’s selections within a fixed 65-survey budget.
We held the budget fixed at 65 surveys and varied the mix. Spending all 65 on last year’s chosen surveys was the worst use of the money. Swapping just six of them for fresh surveys of the new wave lifted accuracy by five to six points. Swapping half was best, lifting it by eight points in both years at identical cost, and back above the bar. And the fresh surveys were picked at random. No clever selection needed; the model simply needs some measurement of the wave it is predicting.
So the deployment rule is simple. Under a fixed budget, reserve about half of it for fresh measurement of the wave you are planning, and let the model reconstruct the rest.
What this means if you run a tracker
Use it to plan, not to autopilot. Treat the predictions as a confident starting point that frees up budget, not a verdict that retires a market for good.
It is reallocation, not retreat. The point is not to survey less for its own sake. On these data, about a third of fieldwork spend could be redirected from predictable surveys towards the markets where fresh measurement demonstrably adds information, or simply saved.
Set the bar deliberately. The good-enough line is a management decision, not a modelling one. Decide it based on what the data is used for, and use the curve to see what it costs.
Refresh every wave. Do not carry last wave’s plan forward untouched. Mix in fresh surveys of the target wave, roughly half the budget on the evidence here.
Watch for shocks. A new entrant, a scandal, a viral moment can turn a stable market volatile overnight. The model cannot anticipate a structural break; only people watching the market can.
- It is reallocation, not retreat. The point is not to survey less for its own sake. It is to move a meaningful share of the budget — on these data, somewhere between a quarter and two-fifths of it — out of predictable slices and into volatile ones, where fresh measurement demonstrably adds information.
- Use savings strategically. Reduced fieldwork can mean lower cost, but it can also mean better coverage: expanding into new markets, adding new audiences, or going deeper where the evidence is most decision-relevant.
- Build in safeguards against drift. A slice that was predictable last year may not stay predictable forever. A new entrant, scandal, viral moment, campaign, or category disruption can change the market quickly. A deployed system should therefore include two safeguards. First, continue to field a small sample of otherwise “skippable” slices as a robustness check. Second, avoid using predicted values as if they were fresh observations in the next wave. In other words, do not let estimates compound into future estimates without being periodically re-anchored in real fieldwork.
- Use it to plan, not to autopilot. Treat the predictions as a confident starting point that frees up budget, not as a final verdict that retires a market for good.
The bottom line
Brand tracking does not have to be all-or-nothing, measure everything or fly blind. The data already in your archive can tell you, with useful precision, which surveys are worth re-fielding and which can be predicted from what you already know. And once you frame it as a budget decision rather than an accuracy contest, the answer to “why isn’t the prediction more accurate?” becomes obvious: because the last few points cost more than they are worth, and you chose not to buy them.
It is, in a sense, the mirror image of the synthetic-audiences debate. That conversation asks whether AI can replace the respondents. This one asks a more immediate and less risky question: of all the surveys you are about to run, which ones do you even need to? For roughly a third of them, the most honest answer is that you already have the data.
Sources and further reading
A curated subset of the work behind this post; full citations appear in the paper.
- Olson et al. (2024), “Examining variation in survey costs across surveys,” Sociological Methods & Research: the per-survey cost figures.
- Groves & Heeringa (2006), “Responsive design for household surveys,” Journal of the Royal Statistical Society A: survey cost as a constraint to be traded against accuracy.
- Bronnenberg, Dhar & Dubé (2009), “Brand history, geography, and the persistence of brand shares,” Journal of Political Economy: why some markets barely move.
- Prokhorenkova et al. (2018), “CatBoost: Unbiased boosting with categorical features,” NeurIPS: the recovery model.
- Yang et al. (2023), “Dataset pruning,” ICLR: why large fractions of training data are often redundant.
- Argyle et al. (2023), “Out of one, many: Using language models to simulate human samples,” Political Analysis: the synthetic-audiences counterpoint.
Disclaimer: This content was created with AI assistance. All research and conclusions are the work of WPP Research.


