You have been given a slot: the specialist will arrive between 09:00 and 11:00. Someone chose those two numbers. They chose them the evening before, for every appointment on the list at once, before knowing how long any single visit would actually take. And the moment they chose them, they changed the problem they were trying to solve.
This is a decision that almost every skilled-service business makes daily and almost nobody optimises directly. A skilled worker — a field technician, a surveyor, a home nurse, a maintenance engineer, a surgeon working through a theatre list — moves through a sequence of jobs whose durations are genuinely uncertain, and each customer or patient has been promised a time in advance. The promise is usually an afterthought: a number bolted onto a schedule after the schedule is fixed, or picked from habit.
At Satalia, WPP’s enterprise AI and optimisation company, this class of problem arrives in production form: last-mile delivery, field-service scheduling, workforce allocation, where the distance between a good answer and a poor one is counted in vehicles, hours and missed appointments. What follows sits one step behind that work — not how to route a fleet or fill a rota, but what to tell the customer once you have. It is the part that reaches the customer directly, and the part most often left to a default.
It is also, less obviously, a brand problem. A quoted arrival time is a promise made in a brand’s name, and one of the very few a customer can verify to the minute. Campaigns set the expectation; the slot is where it is met or quietly broken, at scale, long after the media spend has stopped. Most organisations track the sentiment that results without examining the arithmetic that produced it.
So we wrote it up properly, and asked two questions:
“How should a provider choose the time windows it quotes to customers, and how much of the promised reliability actually survives a day’s work?”
The first has a clean answer. The second is the uncomfortable one.
A PROMISE MADE BEFORE THE FACTS
Two features make quoted windows harder than they look.
The first is that they are all committed at once, before any uncertainty resolves. Nobody knows whether the first job will be a ten-minute adjustment or a three-hour diagnostic, but every window on the list has to be published anyway.
The second is subtler, and is where our contribution sits. Each window a provider quotes changes the conditions under which every later job runs.
Consider a worker who finishes the 09:00 job early and is ready at the next address at 10:40. That window opens at 11:00. They cannot start. They wait.
From the customer’s point of view nothing has happened. Statistically, something significant has. A whole range of possible ready-times — 10:20, 10:35, 10:52 — has been flattened onto a single actual start time of 11:00. In the language of probability, the distribution of start times has been truncated from below at the window’s opening, and the mass below that point collapses into an atom: one outcome carrying a large lump of probability.
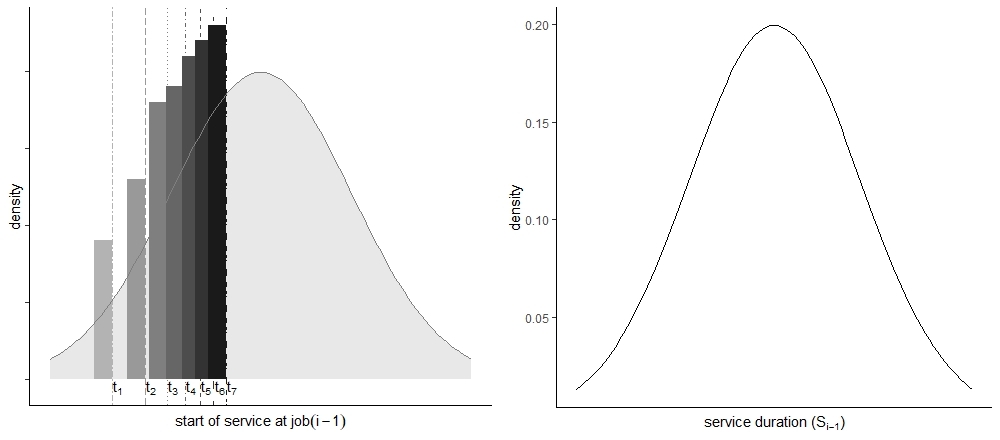
The consequence is that the spread of start times inherited by the next job is not the spread the planner would have faced without the window. It has been squeezed, and squeezed by an amount the planner chose. The promise has become an input to the uncertainty the provider must then manage.
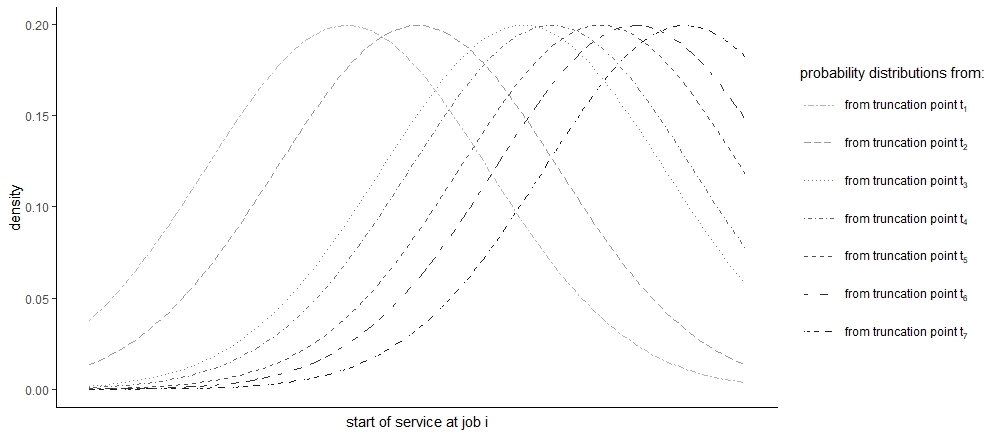
The existing literature handles this in one of two ways, and both give something up. Either windows are taken as exogenous and the resulting waiting is measured after the fact, or the continuous distribution is replaced by a modest set of sampled scenarios, which discards the shape of the tails where the interesting behaviour lives. We do neither: the truncation point is a decision variable, and the distribution is carried in continuous form while we optimise over it.
HOW WE MODELLED IT
Job durations are continuous random variables rather than point estimates. We used three families — gamma, normal and lognormal — parameterised so that mean and variance are controlled independently, which lets us vary how much uncertainty there is separately from what shape it has. That separation matters for one of our findings.
Broken promises cost two different parties, and we price them separately:
- Starting early costs the provider: paid time spent idle at the door.
- Starting later costs the customer, who has organised a day around a window that turned out to be fiction.
Both are charged through penalties with a linear and a quadratic term, so cost rises faster than the deviation itself: forty minutes late is more than twice as bad as twenty. That is a better match to how disruption is experienced than a flat per-minute charge, and it is the functional form used in the service-reliability literature we build on. Work running past the end of the shift is charged separately as overtime.
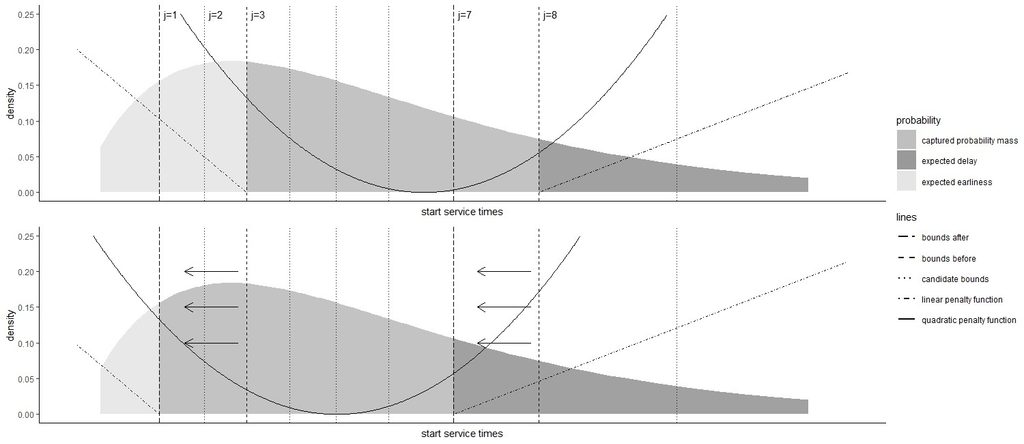
This is the picture worth holding onto. The optimiser is not choosing a width in the abstract; it is sliding a window across a distribution, and every position implies a different split between the two kinds of failure.
Reliability enters as a chance constraint: each quoted window must capture *at least* a specified share of the start-of-service distribution — we tested 50%, 70% and 90%. The optimiser then chooses both the width and the position of every window to minimise total expected inconvenience subject to those constraints.
Note the “at least”. The constraint is a floor, not a target, and it is often not the binding consideration: when penalties make wider windows cheap, the optimiser covers considerably more probability than the minimum demanded. This matters for reading the results later.
Two technical points for anyone who works with models like this. First, the expectations driving the objective are available in closed form — for each candidate truncation point we derive exact expressions for the truncated expected start of service under all three distribution families and embed them directly, so the objective is not a sampled approximation. Second, deciding where a window may begin requires discretising the support of the distribution, and the fineness of that grid is what binds tractability: the resulting mixed-integer quadratic programme grows quickly in both the number of jobs and the number of grid points.
We are candid about the consequence. The formulation is exact and it does not scale. Rather than leave that implicit, we ran a systematic stress test to locate the wall — for each instance family, the finest grid still solvable inside a fixed time budget — and reported the frontier: between 500 and 3,500 grid points across sequences of 5 to 25 jobs, solved to near-zero optimality gaps. Piecewise-linear and convex reformulations are the obvious route past it, and we say so rather than claiming a scalability we do not have.
WHAT WE TESTED
| Dimension | Levels |
|---|---|
| Sequence length | 5, 9, 13, 17, 21, 25 jobs |
| Penalty structures | 5 (baseline, width-weighted, delay-weighted, earliness-weighted, both-weighted) |
| Duration distributions | gamma, normal, lognormal |
| Variability levels | 3, at fixed mean |
| Reliability floors | 50%, 70%, 90% |
| Instances solved to optimality | 810 |
| Simulated days per instance | 1,000 |
WHAT WE FOUND
Window width is driven overwhelmingly by the reliability floor. Raise the floor and windows widen, consistently across every sequence length, distribution and variability level. This follows mechanically from the chance constraints, but its practical value is the ranking: the floor dominates the other levers.
The amount of uncertainty matters much more than its shape — with one qualification worth keeping visible. Expected inconvenience tracked the variance of durations closely and was largely indifferent to distributional family. At the 50% and 90% floors, the median spread in cost across the three families was roughly 2% and 6%. At the 70% floor it widened to about 28%, with the lognormal typically cheapest, because for the same mean and variance it concentrates more mass at shorter durations and permits narrower, better-placed windows at intermediate reliability. The reassuring headline — estimate your variance, do not agonise over the distribution — holds at the extremes and weakens in the middle. Useful to know before relying on it.
Position is a genuine lever, not just width. When earliness was penalised more heavily than lateness, the optimiser systematically shifted windows toward the left tail of the start-of-service distribution, positioning them to catch the fast outcomes and avoid paid idleness — precisely the movement shown in the lower panel of Figure 2. Providers who know whether idle workers or annoyed customers cost them more can act on that, and the effect is large enough to be worth acting on.
And the result that gave us pause: coverage at the moment of promising is not adherence at the end of the day.
Because the windows typically cover more probability than the floor demands, the sharpest comparison is not promise-versus-outcome but coverage-versus-outcome: how much of the start-of-service distribution a window actually captures, against how often service actually began inside it across a thousand simulated days.
| Sequence length | Gap between coverage and realized adherence |
|---|---|
| 5 jobs | 24.6 points |
| 25 jobs | 41.9 points |
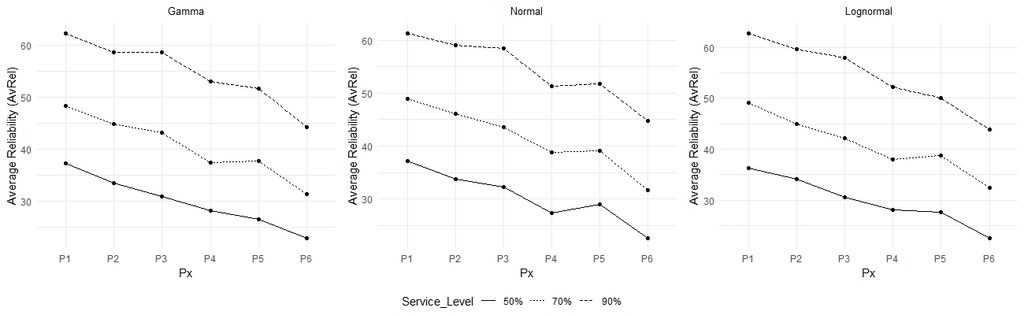
The chance constraint is satisfied exactly. But it describes the distribution faced at the moment the window is quoted, and says nothing about what happens once a full day’s uncertainty has accumulated behind it. The customer served last receives a materially weaker promise than the customer served first, and nothing in the planning output says so.
The practical implication is clear enough. If what you care about is what customers experience rather than what your scheduler asserts, the reliability parameter must be set above your true target, and set higher still for jobs late in the sequence.
THE HONEST CAVEAT
Those numbers need a qualification, and we would rather supply it than have someone else find it.
Our adherence measure is strict to the point of harshness. If the worker arrives before the window opens, waits, and begins at 11:00 exactly, we score that as a failure — even though service started inside the window the customer was given. By any customer-facing definition, that is a success.
So the gaps above are an upper bound on the problem. Some fraction of what we count is a worker idle at the door: a real cost to the provider, but no inconvenience to the person waiting. Decomposing the gap — separating “early and idle” from “late and disruptive” — is the natural next step in the measurement, and we have not done it yet. The direction of the finding is not in doubt. Its exact magnitude is.
We flag this partly because it is honest and partly because it changes what a manager should do. If the gap is mostly lateness, it is a service-quality problem. If it is mostly early idleness, it is a cost problem wearing a service-quality costume. Those call for different responses.
THIS IS NOT REALLY ABOUT ANY ONE PROFESSION
The model does not know what the work is. It sees a sequence of tasks of uncertain duration, performed in a fixed order, each with a time promised to somebody. A maintenance round, a district-nursing schedule and a hospital operating list are the same object to it.
The clinical case may be the most consequential. Surgical durations are among the most variable service times anywhere, the start time a hospital communicates to a patient is a promise of exactly this kind, and one procedure running long displaces every case behind it. That is the same collapse-and-propagate mechanism as the technician waiting at a door, with rather more at stake for the person waiting.
Because the sequence is taken as given, the model also sits on top of whatever produced the schedule — routing software, an appointment system, or an experienced human planner. It is a module for deciding what to promise, not a replacement for deciding what order to work in.
THE TAKEAWAY
Three things worth carrying away, whether or not you ever open an optimiser.
A quoted time is not a passive forecast. It is an intervention that reshapes what happens next, and it deserves to be chosen deliberately rather than inherited from whatever produced the schedule.
If you are estimating uncertainty for a model like this, spend your effort on how much durations vary rather than on which distribution they follow — while remembering that this simplification is strongest at aggressive and relaxed reliability floors and weakest in between.
And treat any service-level figure in a planning system as a claim about the moment of promising, not about the customer’s experience. The two are different quantities, and the difference grows all day.
The full paper, “Quoting Time Windows under Stochastic Service Times: Endogenous Waiting and the Reshaping of Service Uncertainty,” is under Review, and it is available on request.