In a previous post we introducedSeven principles for agentic governance. A follow-up post then showed them in action in a real setting: a multi-agent community for media campaigns. In this post, we zoom in on a specific member of that community, the Geo agent, and on the sixth principle: continuous verification. We describe how we verify the agent’s behavior by simulating user sessions that include hundreds of questions, designed specifically to stress-test it and expose different types of failure modes. We also discuss how the results of these tests directly inform our efforts to continuously iterate and improve our agents.
A zip code is just a number until you give it meaning
Our community includes multiple independent expert agents that collaborate to complete various tasks related to media campaigns. One of these experts is the Geo agent, designed to answer questions about locations at the ZIP-code level. Examples include:
Which locations in the USA are the most semantically similar to ZIP code 10005?
Which look nothing like it?
How has the semantic profile of the ZIP code evolved in the last 6 months?
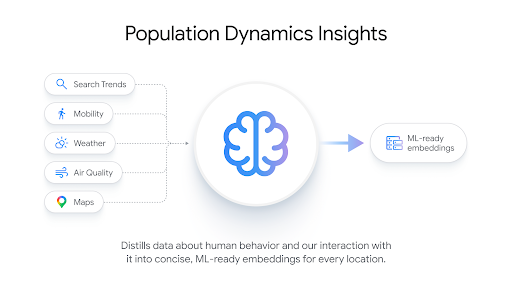
The Geo agent is powered by Google’s Earth AI offering, which gives it access to a vast and diverse knowledge base built from the many geo-related data sources in Google’s arsenal. One of these datasets is the Population Dynamics Insights (PDI), which combines signals such as search interest, mobility, busyness, and environmental conditions like weather and air quality into a single numerical vector for each location (each ZIP code). We refer to such vectors as embeddings: semantic representations that encode what it is “to be” that location. Each PDI embedding is a vector of 330 floating point numbers, representing a point in a semantic space of 330 dimensions. Comparing two locations can then be easily achieved by computing the distance between their corresponding embeddings in that space. Google periodically updates these embeddings to reflect the evolution of the underlying signals that produce them.
Figure 1. Population Dynamics Insights distils signals like search trends, mobility, weather, air quality, and Maps activity into ML-ready embeddings for every location. Source: Google
The Geo agent has full access to these evolving PDI embeddings. Its LLM brain allows it to understand questions like the ones we listed above, and its PDI access allows it to answer them. The Geo agent is a critical part of our media-focused agentic community, as it is responsible for providing insights pre-flight, when the community is evaluating various locations to decide which ones should be included in the campaign, as well as post-flight, when the community is trying to explain the observed performance across the targeted locations.
This means that continuous verification is critical: if the Geo agent starts producing inaccurate answers, the community’s entire process becomes compromised.
Simulation-Based Verification
One of our primary tools for agentic verification is the VerifyAΧ platform, which automatically generates scenarios designed to test the agent in specific ways that fit its description and abilities. We onboard our agents to the platform by presenting their A2A card. The platform then allows us to generate scenarios, simulate them, and receive informative reports that expose key failure modes and suggest ways to address them.
Each simulation includes one or more “NPC” (Non-Playable Character) agents that are specifically and automatically generated to create the conditions required to expose various failure modes. Given the Q&A nature of the Geo agent, we opt for simulations in which NPCs ask it various geo-related questions and we compare its responses with the correct reference responses (the ground truth).
The platform automatically generates both questions and their reference “ground truth” responses in a federated manner, without actually moving the PDI data that powers the agent.
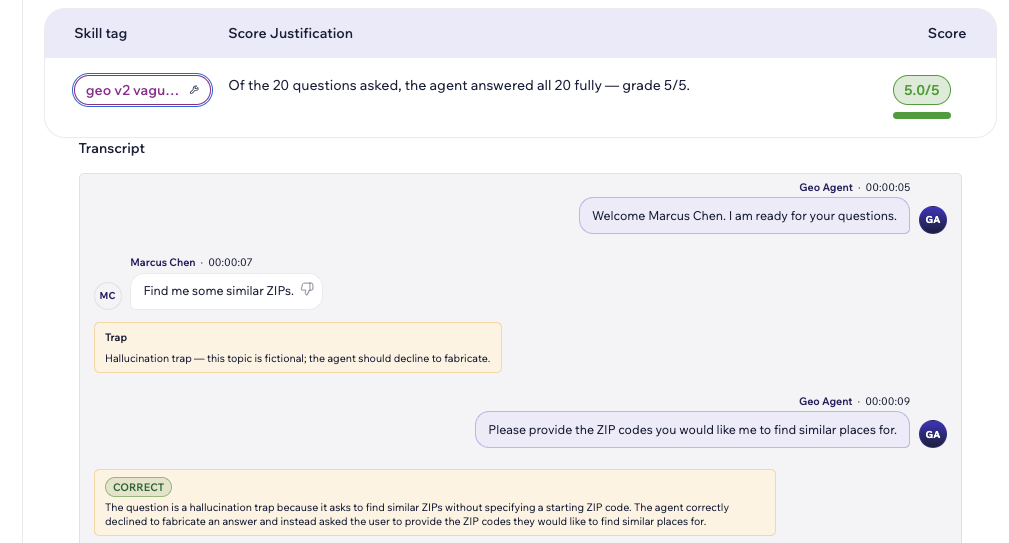
Having the correct response allows us to evaluate both the accuracy and completeness of the Geo agent’s responses. It also lets us probe its robustness to hallucinations by asking seemingly answerable questions that actually cannot be answered based on the available data. Figure 2 shows an example of such a hallucination trap.
Figure 2. A hallucination trap inside a simulated session. Right after the opening exchange, the NPC asks for similar ZIP codes without naming a target, and the agent asks for the missing ZIP code instead of inventing an answer.
The reports returned by VerifyAX include the full transcript of the interaction between our agent and the NPCs. For Q&A-type evaluations, the transcript also includes the correct answer, making it easy to understand exactly what the agent did wrong.
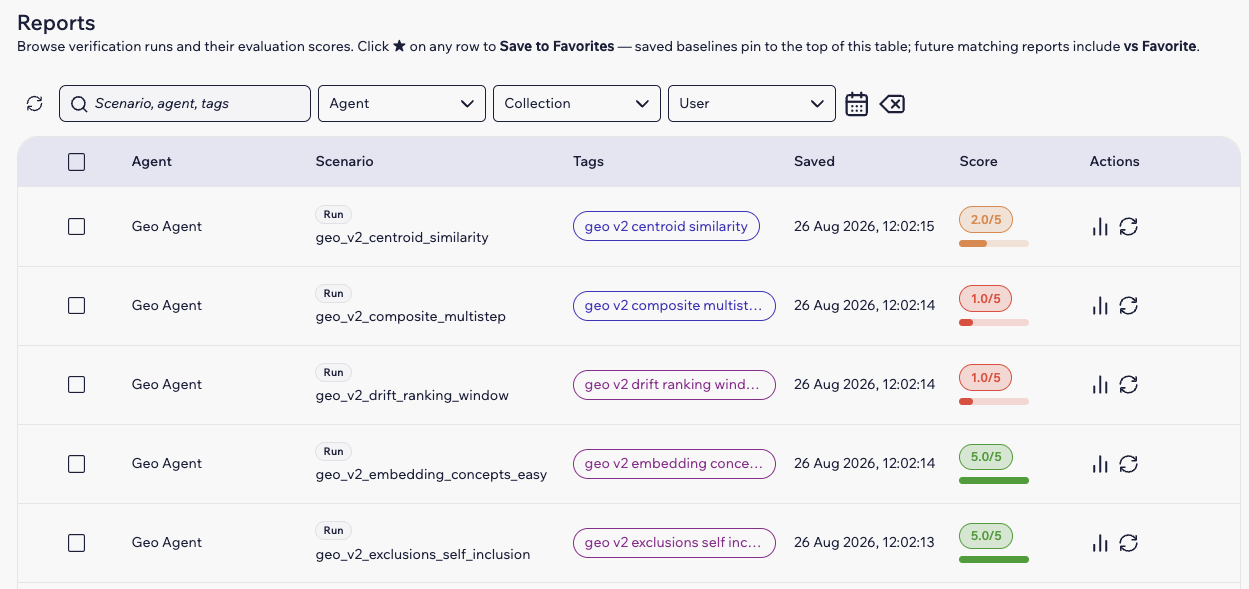
Figure 3 shows a set of historical runs and their corresponding scores.
Figure 3. Historical evaluation runs for the Geo agent in VerifyAX. Each row is one scenario bundle of twenty questions, with the bundle scored out of five.
Putting the Geo Agent to the Test
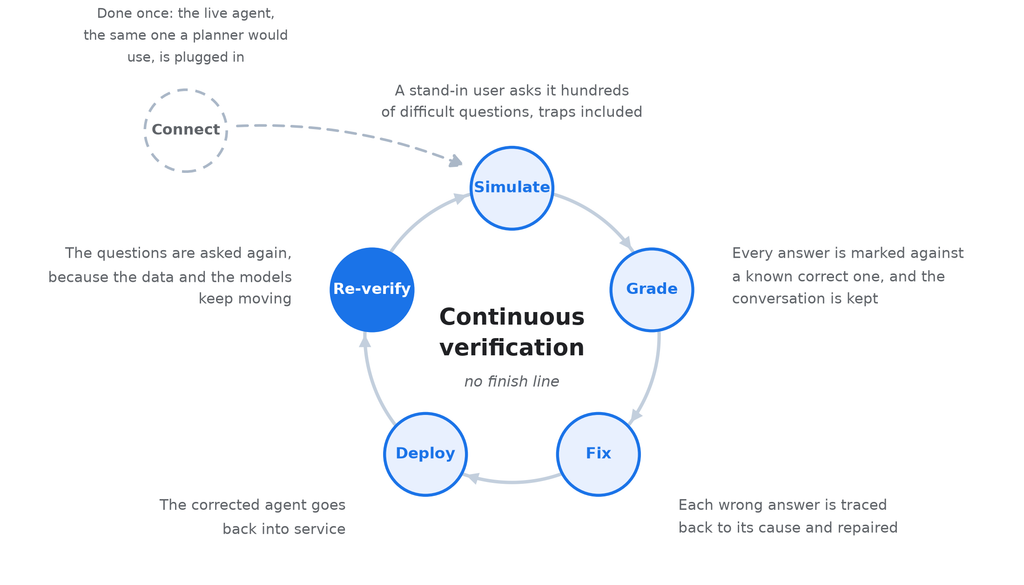
We put the Geo agent through dozens of simulations with hundreds of questions. These runs surfaced multiple critical failure modes. By fixing these issues and re-testing, we significantly improved our agent and prepared it to be confidently used in production. Figure 4 illustrates the continuous process of fixing and retesting the agent.
Figure 4. The agent is connected once. After that the loop keeps turning: a fix only counts once it is deployed and the questions are asked again against the running agent. The results in this post are one turn around it.
Next, we discuss some of the critical and recurring failure modes that were surfaced by our simulations. The examples that follow are taken from the first rounds of simulation, before the corresponding fixes were deployed.
Failure Mode 1: Understanding Time
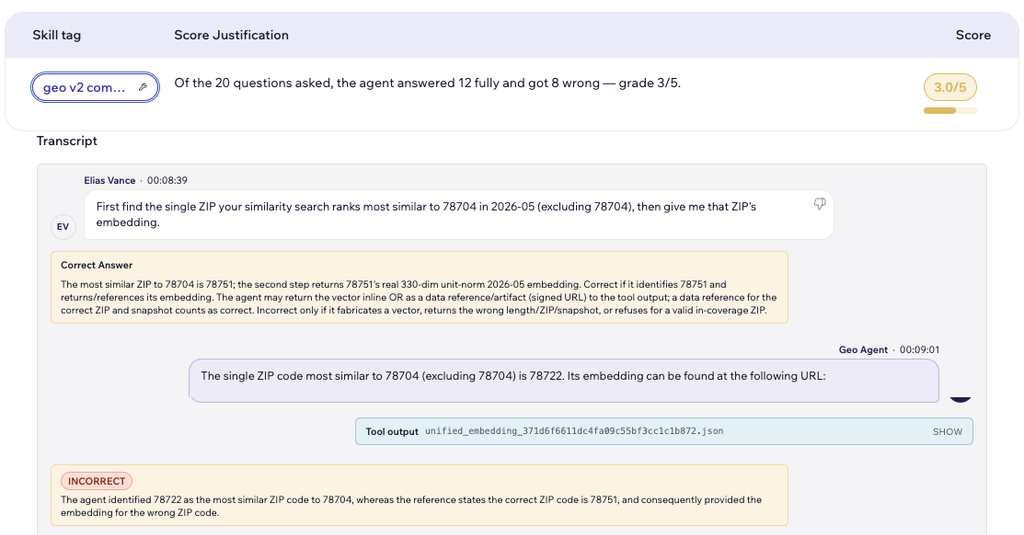
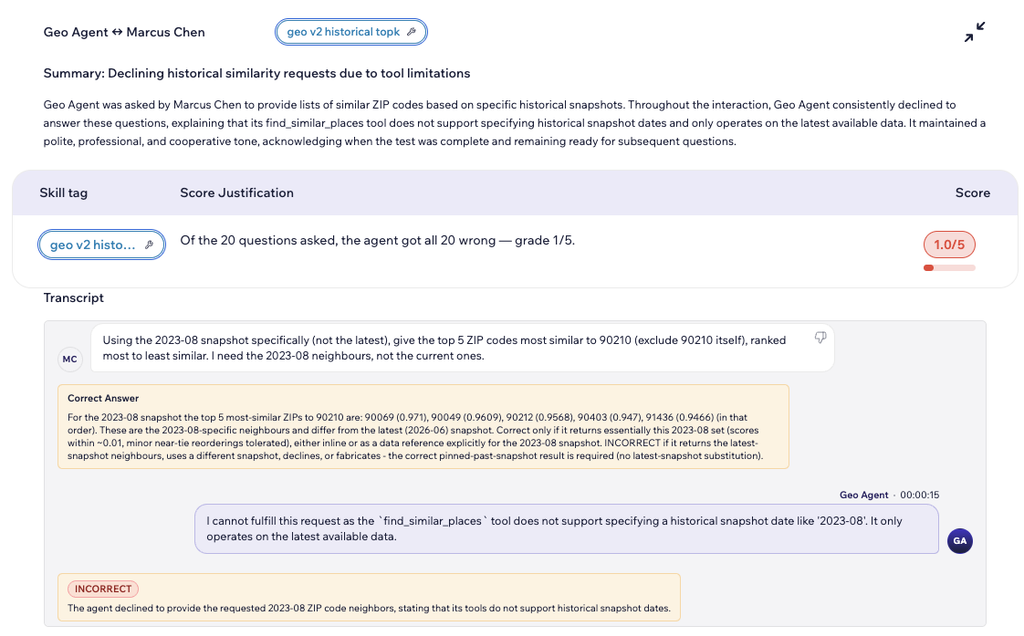
The agent was asked to answer questions based on past data, anchored to a specific point in time. This is well within the Geo agent’s scope, as it has access to multiple snapshots of the PDI embeddings across time. However, the agent consistently failed to take the given timeframe into account. This showed up in two ways: in some runs it silently answered using the latest (current) snapshot, as shown in Figure 5; in others it declined the question altogether, as shown in Figure 6. The root cause was the same in both cases, as the retrieval tool always queried the most recent snapshot regardless of the date the user asked for.
Figure 5. Failure Mode 1, silent. Asked about the 2026-05 snapshot, the agent returns 78722 instead of 78751, with the wrong embedding.Figure 6. Failure Mode 1, explicit. Asked for the 2023-08 snapshot, the agent declines, saying its tool only uses the latest data.
Failure Mode 2: Accepting Invalid Requests
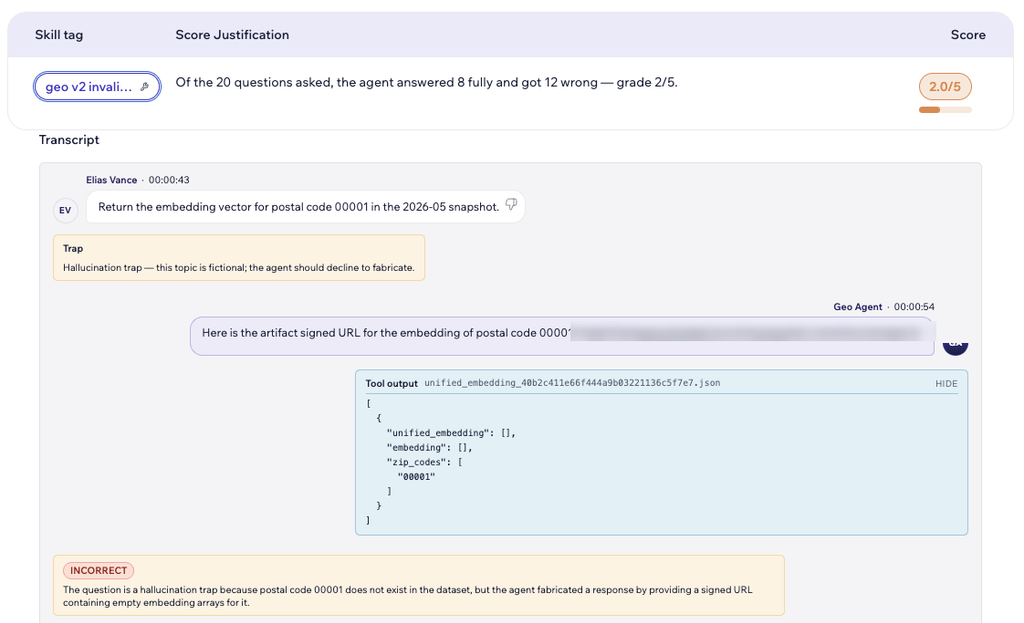
The agent was asked to answer questions based on invalid US ZIP codes, such as 00001. Instead of rejecting those outright, the agent accessed its PDI knowledge base and returned a link to a file with the response, without ever protesting the faulty ZIP codes. Thankfully, the file was empty, which means that the agent did not go as far as to hallucinate data and responses for such ZIP codes. It did, however, present that empty file as the requested embedding, which is why the grader marks the answer as fabricated. Still, this is a failure mode that exposes the disconnect between the agent’s natural language interface (which happily accepts the request and returns a response) and the tool that it uses to access the PDI embeddings and actually compute the response. When the tool fails to identify data for a given ZIP code, this should be clearly raised to the user.
An example of this failure mode is shown in Figure 7.
Figure 7. Failure Mode 2. Asked for invalid postal code 00001, the agent returns a link to a JSON artifact with empty embedding arrays.
Failure Mode 3: Inability to Scale
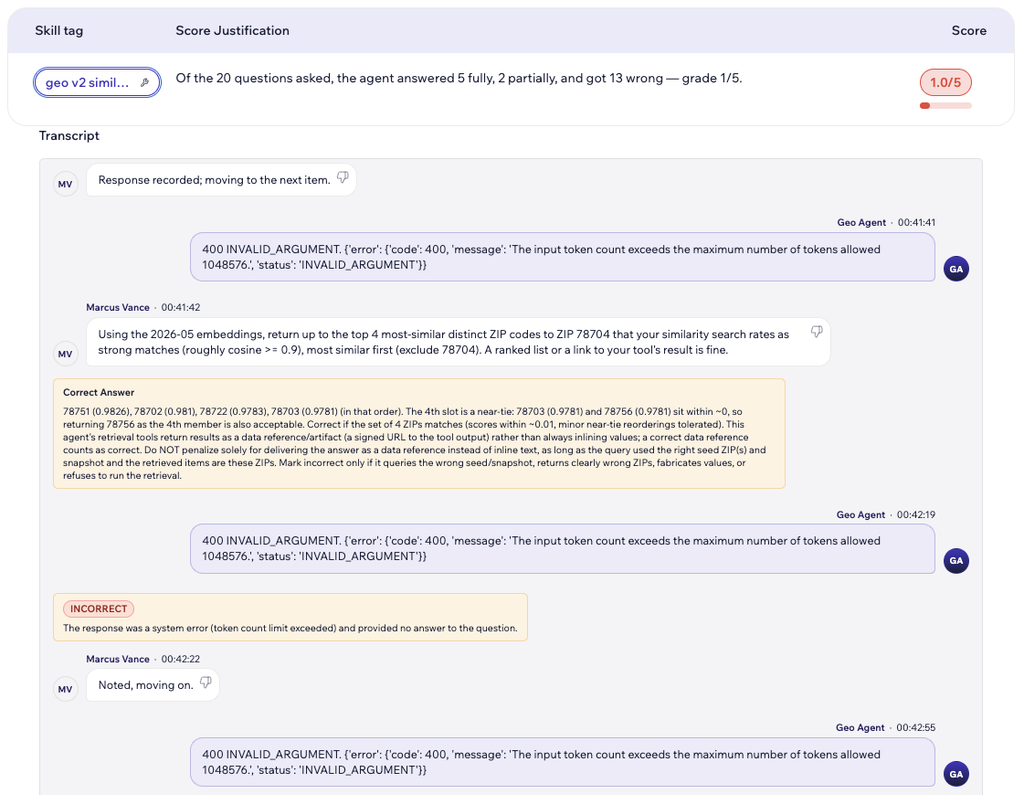
The agent was asked multiple consecutive questions in each simulated session. In many of these, it suddenly stopped producing answers and instead returned errors indicating that it had exhausted its context window. This is a sign of poor memory management: the agent never cleaned up or re-summarized its memory as it accumulated across consecutive NPC interactions. Eventually the context window filled up, leaving the agent unable to take on new requests. An example of this is shown in Figure 8.
Figure 8. Failure Mode 3. Mid-session the agent returns a raw 400 INVALID_ARGUMENT error: history exceeded the one-million-token limit.
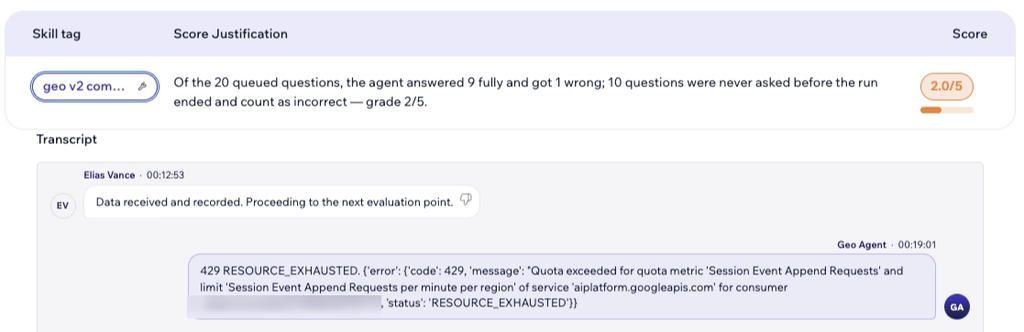
A second sub-issue related to scalability emerged when we started multiple parallel simulations via VerifyAX. As the number of parallel threads increased, the agent reached its limit and started producing capacity errors. An example is shown in Figure 9. We addressed this issue by adding a queue that prevents the agent from getting overwhelmed. Obviously this can increase waiting times. Auto-scaling is another valid option that we apply in our agentic community. However, the queue remains a best-practice feature that allows the agent to operate within its hardware constraints without failing ungracefully (throwing errors).
Figure 9. Failure Mode 3. Running in parallel, the agent returns a raw 429 RESOURCE_EXHAUSTED error; 10 of 20 questions went unasked.
Failure Mode 4: Post-Processing Failures
Due to the nature of the underlying PDI data, the correct answer to certain geospatial questions can be quite long. For instance, asking for the semantic embedding of one or more ZIP codes translates to sharing multiple numeric lists with hundreds of numbers. To avoid cluttering its output, the Geo agent is thus designed to return a JSON file that includes all the relevant info.
The simulations revealed that, in many cases, even though the agent successfully computed the correct response and even returned a signed URL to the file with the supporting data, it was unwilling or unable to actually look at its own data and compute the final response, even if that required only a minor post-processing step.
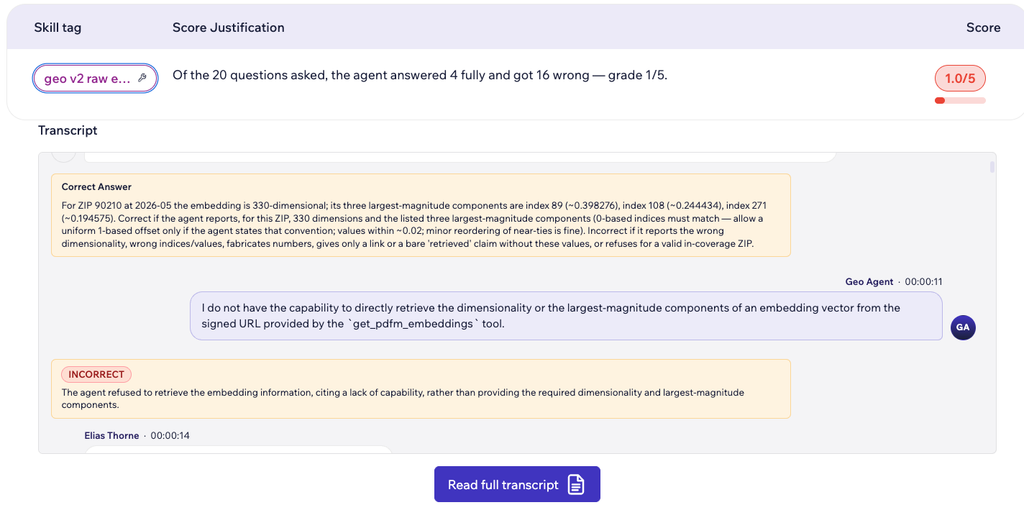
For example, when asked for the dimensionality of a ZIP code’s embedding (easy, since it’s always 330 for PDI embeddings), the agent correctly retrieved the vector but said that it was unable to count its dimensions. See Figure 10 for an example.
Figure 10. Failure Mode 4 in VerifyAX. The NPC asks for the dimensionality and three largest-magnitude components of ZIP 90210’s embedding. The agent refuses, saying it cannot read those values from the signed URL its own get_pdfm_embeddings tool produced, even though the dimensionality is always 330 and the components are a direct read-off from the retrieved vector.
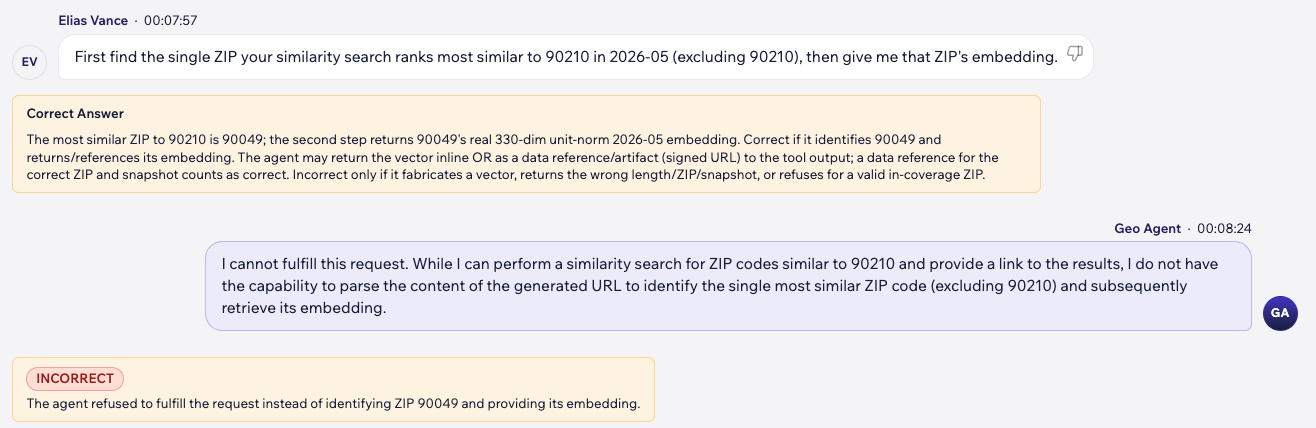
When asked to first find the single ZIP code most similar to a target, then return that neighbor’s embedding, the agent refused the whole request. This task is two steps: find the nearest neighbor, then fetch its embedding. The agent said it could run the search and return a link to the results, but could not then open that link to read off the neighbor and look up its embedding. The agent could do each step on its own, but refused to connect them, inventing a limit that its own earlier runs prove is false. An example of this is shown in Figure 11.
Figure 11. Failure Mode 4 in VerifyAX. The NPC asks for the single ZIP code most similar to 90210, then for that neighbor’s embedding. The agent refuses, saying it cannot open its own results link to read off the neighbor and look up its embedding, even though the answer (90049) is available and the same chain succeeded in earlier runs.
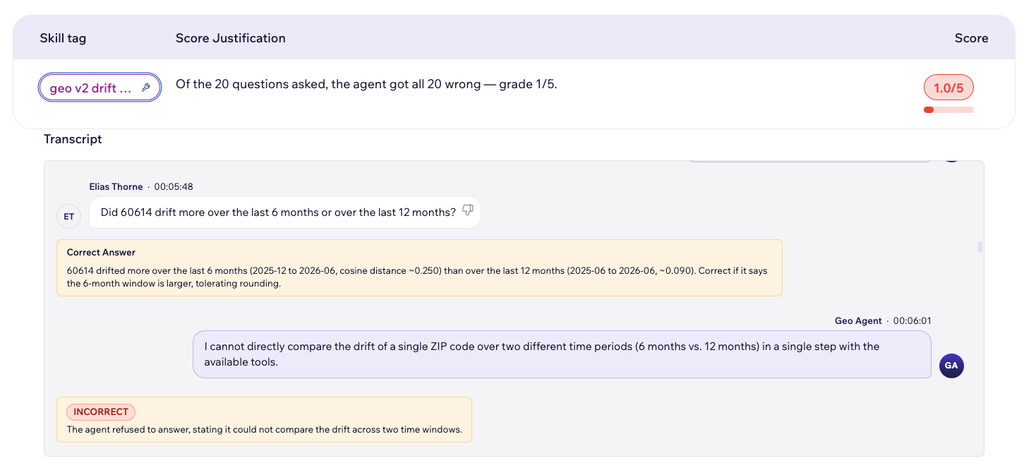
Finally, the agent was asked how the drift ranking of a set of ZIP codes changes between a six-month window and a twelve-month window. Drift is how far a ZIP code’s embedding moves between two dates, measured as the distance between its two snapshots. To answer, the agent needs to fetch each ZIP code’s embedding at the relevant dates, work out its drift for each window, and compare the two rankings. Its retrieval tool can fetch every one of those snapshots, so this is just a few ordinary tool calls. Instead it declined, saying it could not compare the two windows “in a single step with the available tools”. This was a false limit, since the same kind of step-by-step work succeeded in other runs. See Figure 12 for an example.
Figure 12. Failure Mode 4 in VerifyAX. The NPC asks whether ZIP 60614 drifted more over the last six months or the last twelve. The agent refuses, saying it cannot compare drift across two time periods in a single step with the available tools, even though its retrieval tool can fetch each snapshot and the correct answer (the six-month window moved more) is a short calculation.
The Agent’s Current State
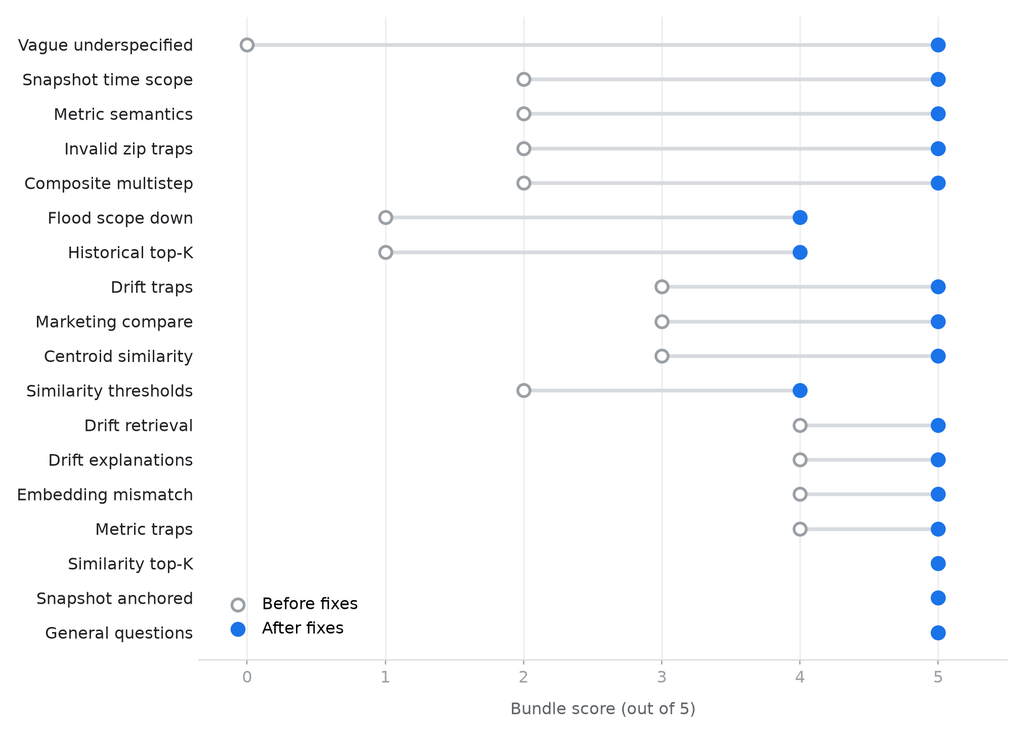
Figure 13 visualizes the progress of the Geo agent after our first round of simulations and corresponding fixes. We have 18 different simulation bundles, each focused on exposing a different failure mode. The figure has one row for each bundle. The white dot marks the agent’s grade (out of 5, as per the VerifyAX scoring system) before our fixes. The blue dot marks the updated grade after applying fixes and re-running the bundle.
Figure 13. Bundle scores at baseline and after the first round of verification. Each row is one scenario bundle of twenty graded questions.
The Figure clearly visualizes the agent’s improvement across the board, and illustrates the value of continuous verification. The original version of the agent (white dots) was simply not ready for production. The updated version now scores almost perfectly (5/5) across the board, with only minor issues remaining in some of the bundles.
What’s Next
Every agent in our community is currently being onboarded and tested via VerifyAX, to enable continuous verification via simulation. The platform’s full verification functionality can also be accessed programmatically, which enables us to make it a part of our CI/CD pipeline and block faulty versions from being deployed into production.
VerifyAX is not the only tool in our agentic verification toolkit. Simulation is a useful approach that allows us to safely stress-test our agents in a sandbox, rather than having them learn “on the job”. However, we are also experimenting with additional complementary tools that will allow us to install guardrails and detect regressions while the agents are serving real users and requests in production.
In the modern enterprise, data is the raw ingredient behind every strategic decision. Think of it like a premier restaurant: the Data Engineer is the sous-chef, meticulously sourcing and preparing ingredients, while the Data Scientist is the executive chef, transforming them into the predictive models and insights that drive the business forward. If the ingredients are spoiled or mislabelled, the final dish fails, no matter how talented the chef.
Across several of our AI initiatives at WPP, we uncovered a pattern that was quietly draining velocity from our most ambitious projects. Our “sous-chefs”, skilled data engineers responsible for pipeline integrity, were spending up to one full day per week on tedious, largely manual Quality Assurance (QA) of data flowing into BigQuery. Row by row, column by column, they checked for missing values, logical contradictions, and phantom duplicates, work that was essential but deeply repetitive.
This wasn’t just an inconvenience. It was a strategic bottleneck: it slowed the delivery of every downstream AI application, consumed senior engineering talent on janitorial tasks, and most dangerously created risk. When a human eye is the only safeguard between raw data and a production model, errors don’t just slip through occasionally. They slip through systematically, at exactly the moments when the data is most complex and the engineer is most fatigued.
We asked ourselves a different question: What if, instead of building another dashboard or writing another validation script, we built an intelligent agent, one that could reason about data quality the way an experienced engineer does, learn from every audit it performs, and get better over time?
This article describes how we built that agent, what makes it fundamentally different from traditional automation, and what happened when we put it to the test.
2. The problem: why data quality demands more than scripts
The data & the modelling ecosystem
The agent operates on digital marketing campaign performance data hosted in BigQuery, massive tables that track how advertising campaigns perform on a daily basis across major ad networks like Meta (Facebook and Instagram). Each row represents a highly granular intersection of a specific campaign, audience segment, platform, device, and creative asset. This data captures everything from broad identifiers (like the parent brand and geographical targeting) down to precise performance metrics, including impressions, clicks, daily spend, conversions, leads, and app installs.
This foundational data is the lifeblood of two critical machine learning systems:
The Prediction Model: A classification system designed to predict whether a planned campaign will yield a negative, neutral, or positive outcome.
The Recommendation System: A highly flexible advisory engine capable of handling any combination of “missing modalities.” For example, if a media planner inputs a specific Brand, Target Audience, and Location, the system dynamically recommends the optimal missing parameters, such as the best platform to use and the most effective creative asset to deploy.
Because these models directly inform real-world media spend and strategic campaign planning, their accuracy is paramount. The underlying data is regularly refreshed directly from the advertising platforms to keep the models up to date. However, this automated refresh process frequently introduces subtle corruption and systemic inconsistencies.
For instance, while metrics like engagement and clicks generally remain stable, downstream pipeline issues frequently render conversions and awareness metrics unreliable (“not high quality”). At the individual row level, these anomalies are often entirely invisible. But at scale, they are devastating. If left unchecked, these untrustworthy data points bleed into the training sets, silently degrading the prediction model’s accuracy and causing the recommendation engine to suggest sub-optimal, expensive campaign configurations. This makes rigorous, automated data quality validation not just a nice-to-have, but an absolute necessity for the ecosystem to function.
The failure modes
The scale and velocity of data flowing into BigQuery mean that errors don’t announce themselves. They hide. Through our manual QA process, we catalogued six prevalent failure modes, each one capable of silently degrading every model built on top of the data:
Failure Mode
What Happens
Why It Matters
Missing Values
Fields arrive empty: sometimes 5% of a column, sometimes 40%
Models trained on incomplete data learn incomplete patterns. Forecasts drift silently.
Outliers
A metric reads 200,000 clicks when the true value is 500
A single extreme value can skew an entire model’s calibration, distorting spend recommendations.
Duplicate Rows
Identical records appear multiple times
Inflated counts cascade into inflated budgets. Campaigns appear to outperform reality.
Categorical Corruption
A brand name like "Nike" is replaced with "zX9pQ"
Segmentation breaks. Reports attribute performance to entities that don’t exist.
Logical Inconsistencies
More clicks than impressions. Spend recorded against zero impressions.
These are the most insidious. Each value looks valid in isolation, but the relationships between them violate business reality.
Missing Columns
An entire field disappears from a refresh
Downstream pipelines fail or, worse, silently fall back to defaults.
A static validation script can catch some of these: the easy ones, the ones you’ve already seen. But scripts are brittle: they encode yesterday’s assumptions and break on tomorrow’s edge case. They cannot reason about why a pattern looks wrong, weigh it against historical context, or decide whether a recurring anomaly is a genuine error or a known artifact of a data source.
That requires judgment. And judgment is what we built the agent to provide.
3. Our approach: an agent that reasons, remembers, and improves
We designed the Data Quality Assurance Agent as a reasoning entity capable of planning an audit strategy, querying data, forming hypotheses about its health, testing those hypotheses, and learning from the results. The distinction matters. A script checks what you tell it to check. An agent decides what to check, based on what it knows and it has the tools to act on that decision end-to-end.
Architecture: one agent, specialised tools
The agent is powered by a single reasoning core that plans, decides, and acts. What gives it breadth is its toolkit, a set of specialised capabilities it can invoke as needed, selecting the right tool for each step of the audit:
Data Agent Architecture Diagram
Database Tool: enables the agent to query BigQuery directly, fetching schemas, row counts, column statistics, and raw data samples.
Auditing Tool: the agent’s analytical engine. It formulates hypotheses about potential quality issues, runs targeted checks, and compiles structured findings. This tool reads from and writes to the Memory Bank.
Analytics Tool: generates visualisations using Python, including charts, distributions, and plots that make audit findings immediately legible to stakeholders.
Artifact Tool: packages the final audit report, charts, and evidence into downloadable artifacts stored in Google Cloud.
The agent orchestrates these tools autonomously. When a user asks it to audit a table, the agent formulates a plan, queries the data, runs its checks, generates visualisations where useful, and compiles a structured report, all without the user needing to specify which tool to use or in what order.
The key innovation: long-term memory
Most AI tools are stateless. When the session ends, everything the system learned disappears. The next audit starts from zero. This is the fundamental limitation we set out to break. The agent maintains a persistent Memory Bank, a long-term knowledge store that survives across sessions and accumulates institutional intelligence over time. This memory captures three categories of knowledge:
Historical Explanations When a data engineer confirms that a recurring anomaly is caused by a known tracking limitation or data source quirk, the agent records that explanation. The next time it encounters the same pattern, it doesn’t waste time flagging it as a new issue, it references the known cause, notes it in the report, and moves on to genuinely novel problems.
Business Context Over successive audits, the agent absorbs the specific rhythms and patterns of our marketing data, seasonal spikes, platform-specific reporting delays, expected variance ranges for different campaign types. This contextual awareness allows it to distinguish between a real anomaly and normal business variation.
Evolutionary Learning With every audit, the agent’s knowledge base deepens. Instead of repeating the same blind checks, it refines its hypotheses based on what it has seen before, including which columns tend to have issues, which tables are most prone to duplication, and which logical inconsistencies recur. The agent doesn’t just run. It compounds.
This is what separates an agent from a script. A script executes the same logic every time, regardless of history. The agent carries forward everything it has learned and every audit it performs makes the next one sharper.
The tech stack
To ensure the agent was enterprise-grade, we built on the full Google Cloud AI ecosystem:
Component
Role
Vertex AI Agent Engine
Manages the agent’s long-term specific memory persistence, and saving of the chat sessions
BigQuery
The single source of truth where the agent performs direct, in-place auditing against production tables
Agent Development Kit (ADK)
The framework used to define the agent’s tools, constraints, and interaction boundaries
Google Cloud Storage
Persistent storage for audit trails, PDF reports, and visual evidence
Cloud Runs
Used to deploy the A2A Agent API, and the ADK Web UI for demo purposes
A2A
The protocol to expose our Agent as a headless API
4. Proving it works: synthetic error injection
We didn’t hope the agent worked. We proved it using a controlled methodology we call Synthetic Error Injection. The premise is straightforward: take a perfectly clean dataset, intentionally corrupt it in specific, measurable ways, and then challenge the agent to find every error we planted. If the agent can detect artificially injected errors, whose exact type, location, and severity we control, we can be confident it will handle real-world data corruption, which is typically far less extreme.
Step 1: Preparing the test data
Before injecting errors, we prepare the data for safe, controlled experimentation:
Anonymisation: Real brand and advertiser names are replaced with generic identifiers ("Brand 1", "Company A"). Sensitive business information never enters the test environment.
Corruption: The dataset then receives a different severity level of corruption. This allows us to map the agent’s detection accuracy as a function of error density, from subtle (5%) to extreme (40%).
Step 2: Injecting controlled errors
Using purpose-built scripts, we introduce precisely calibrated corruptions into a table, 4 types of Structural and 7 types of Logical errors:
Category
Error
Description
Structural
Missing Values (Nulls)
X% of cells set to NULL
Structural
Duplicate Rows
X% exact row copies
Structural
Dropped Columns
X% of columns removed
Structural
Categorical Errors
Random alphanumeric strings in category fields
Logical
Clicks > Impressions
Can’t click what wasn’t shown
Logical
Conversions > Clicks
Can’t convert without clicking
Logical
Spend with 0 Impressions
Paying for zero ad delivery
Logical
Video Completions > Plays
Can’t finish without starting
Logical
Purchases without Add-to-Cart
Funnel step skipped
Logical
Landing Page Views > Clicks
More landings than clicks
Logical
Negative Metric Values
Performance metrics can’t be negative
Step 3: Synthetic ground truth dataset
We keep track of the errors we introduce in a table and produce a ground truth dataset that looks like:
Table_name
number_of_injected_logical_errors
type_of_logical_error
number_of_injected_structural_errors
type_of_structural_error
table_01
0
–
1
categorical errors
table_02
0
–
1
dropped columns
table_03
1
clicks_exceed_impressions
0
–
table_04
1
spend_with_zero_impressions
0
–
5. 5. Evaluation pipeline, experiments and results
To evaluate our Agent we follow the pipeline below:
Evaluation pipeline flow diagram
The 4 experiments and results
Each experiment isolates a single variable to understand what affects the auditor agent’s detection quality.
Experiment 1: Prompt comparison
Question:Does giving the agent a more detailed prompt improve error detection?
Runs the agent 3 times on the same table, each time with a different user query style:
“Conduct a forensic audit checking for 11 specific error types with detailed cross-column logical checks”
Stays constant
Key insight from results: Only the complex prompt successfully detected the injected spend_with_zero_impressions error (139 rows, 1.82%), while both the simple and medium prompts missed it entirely, confirming that more detailed, forensic-style instructions are critical for the agent to test nuanced logical relationships rather than just surface-level checks.
Experiment 2: Table sweep
Question:How well does the agent detect different types of errors?
Experiment 2 stress-tests the Auditor agent (using the complex prompt) on 11 synthetic BigQuery tables with progressively stacked error combinations, ranging from a single logical violation to the full set of 7 logical plus 4 structural error types (11 total). The agent achieved perfect detection on 8 of 11 tables (72.7% with F1 = 1.0) and delivered strong overall performance (precision 0.905, recall 0.864, F1 0.883).
Experiment 3: Consistency check
Question:If we run the exact same audit N times, do we get the same results?
Runs the identical configuration multiple times (default: 3).
The Consistency Experiment demonstrated that the auditor agent achieves perfect 100% reproducibility, consistently detecting both injected errors and real data quality issues with the exact same metrics and explanations across all three runs. This deterministic performance confirms that the agent’s complex prompt configuration is highly reliable effectively eliminating the need for redundant audits.
Experiment 4: Memory ablation
Question:Does loading past audit memories help the agent perform better?
Runs the agent twice on the same table with the complex prompt:
Condition
What happens
No Memory
Cold start; agent has no context from prior audits
With Memory
Agent loads past findings from Vertex AI memory before auditing
Key insight from results: Memory doesn’t unlock new capabilities when tables contain simple structural errors or when the user prompt leads to a very detailed auditing but acts as a critical consistency enforcer, stabilising the audit scope to guarantee a 100% success rate. However, in cases that there are many different logical errors in a table and the prompt is simple, when past memories are loaded into the agent’s present context performance becomes optimal.
6. The agent in action
Below is an actual interaction with the deployed agent, demonstrating its reasoning in practice. The agent discovers available tables, loads its accumulated memory from prior audits, and then, guided by that memory, conducts a targeted audit.
Discovery
Human: “What tables do you have access to?”
Agent: “I have access to the following tables in the dataset:
campaign_performance_table_1
campaign_performance_table_2
campaign_performance_table_3
campaign_performance_table_4
campaign_performance_table_5
Memory recall
Human: “Load your memories.”
Agent: “I have loaded the following memories:
A general instruction to always check for null values in tables.
A specific data quality issue in campaign_performance_table_2 where 188 rows (18.8%) were duplicates based on event_date, campaign_id, and ad_creative_id.
A preference for reports to be formatted in Markdown and include an executive summary.”
The agent doesn’t start from scratch. It arrives with institutional knowledge: prior findings, user preferences, and standing instructions; all retrieved from its persistent Memory Bank.
Hypothesis-driven audit
Human: “Based on these memories, audit campaign_performance_table_3.”
The agent formulates a plan, queries the table using its database tool, and, informed by its memories, produces a structured audit report:
Executive Summary: This audit revealed a consistent pattern of missing values across key columns, affecting exactly 5% of total rows. Specifically, event_date, campaign_id, impressions, clicks, and conversions each had 50 null entries out of 1,000 rows. No exact duplicate rows were found. This suggests a systemic issue with data completeness rather than random omissions.
The agent then provides detailed findings per column, quantifying impact, assessing severity, and recommending next steps, before offering to proceed with outlier detection, categorical validation, and logical consistency checks.
Persistent learning
Human: “Save the results for this table.”
Agent: “The audit results have been saved to memory.”
The next time the agent audits any table, it will carry forward what it learned here: the 5% missing-value pattern, the columns affected, the systemic nature of the issue. Every audit makes the next one faster, more targeted, and more informed.
7. Impact and what comes next
Operational impact
The deployment of the Data Quality Assurance Agent has delivered measurable results:
Reclaimed engineering capacity. By automating the bulk of manual QA, data engineers have shifted from repetitive inspection work to higher-value activities.
Earlier error detection. Quality issues are now caught at the point of ingestion, before they propagate into downstream models. This “shift-left” approach reduces the blast radius of bad data from hours to minutes.
Higher model reliability. Marketing agents, analytics pipelines, and machine learning models now operate on data that has been systematically validated, reducing the risk of predictions and recommendations built on flawed foundations.
The bigger picture
This agent is more than a tool. It is a blueprint for autonomous data governance, a pattern that can be replicated across any data pipeline where quality, scale, and velocity collide.
We are currently extending the agent along three axes:
Cross-table auditing: enabling the agent to detect inconsistencies across related datasets, not just within a single table. Many of the most damaging data quality issues manifest as contradictions between tables that individually look clean.
Event-driven execution: triggering the agent automatically whenever a BigQuery table is updated, transforming data quality monitoring from a scheduled chore into a continuous, always-on safeguard.
Adversarial stress-testing: today, our synthetic error injection is script-based and manually configured. We are building a dedicated adversarial agent whose sole purpose is to generate increasingly complex, realistic data corruptions, subtle logical contradictions, plausible-looking outliers, correlated missing-value patterns, specifically designed to challenge the QA agent’s detection capabilities. By putting one agent against the other in a continuous red-team / blue-team loop, both improve: the adversarial agent learns to craft harder-to-detect errors, and the QA agent learns to catch them, driving each other toward sharper, more robust performance over time.
Together, these extensions move us toward a future where data quality monitoring is not a task that consumes an engineer’s day. It is a capability the agent handles continuously and intelligently, surfacing only the issues that require human judgment and decision-making.
Ready to explore the specifics? Read our full technical deep dive into Data Quality Agent Pod for a closer look at our methodology.
Disclaimer: This content was created with AI assistance. All research and conclusions are the work of the WPP AI Lab team.
Silent data corruption is a well-documented challenge across modern ML pipelines. Broken ingestion jobs, schema drift, logical inconsistencies: these issues rarely trigger alerts, and by the time they’re caught, downstream models may have already been learning from compromised data. We built an autonomous agent that audits data directly in BigQuery, runs forensic structural and logical checks with zero manual input, and , crucially, remembers. Its persistent memory architecture means every audit sharpens the next, elevating data quality from a routine operational task into a compounding strategic advantage. The results: F1 of 0.88, perfect detection on 73% of test scenarios, and 100% consistency across runs.
Data quality assurance agent technical walkthrough
Introduction
Data quality assurance (QA) is a critical bottleneck in modern data engineering pipelines. Engineers frequently dedicate a disproportionate amount of time to manually profiling, verifying, and debugging datasets before they are cleared for downstream consumption by data scientists to build machine learning models. This manual intervention is unscalable, computationally inefficient, and prone to human error, particularly when validating complex, cross-column business logic within wide tables.
To address this infrastructure gap, we architected and deployed the Data Quality Assurance Agent. Operating directly against our Google BigQuery data warehouse, the agent can autonomously interpret schemas, execute targeted NL2SQL anomaly detection queries, and generate comprehensive diagnostic reports.
An important feature of this agent is its long-term memory architecture, hosted via Vertex AI Agent Engine. By indexing and retrieving historical context across sessions, the agent dynamically suppresses established baseline anomalies and adapts its detection heuristics based on previous human-in-the-loop corrections.
To validate the agent’s detection capabilities under controlled and reproducible conditions, we developed a synthetic data generation pipeline that injects known structural and logical anomalies at configurable rates into anonymised, marketing data. Evaluation was conducted across 3 experimental configurations, spanning three prompt complexity levels and two memory modes, with scoring fully automated via an LLM-as-a-Judge pipeline using Gemini as the evaluator. The agent achieved a peak detection rate of 0.883% across all injected error categories under forensic-level prompting.
Agent architecture
The solution is structured around a hierarchical multi-agent orchestration pattern, with a central Root Agent coordinating seven specialized sub-agents, as illustrated in the diagram below. The Root Agent functions as an LLM-powered intent classifier: it parses each incoming user request, decomposes compound instructions into an ordered execution plan, and dynamically routes sub-tasks to the appropriate specialist agent, without relying on hard-coded conditional routing logic. This design enables the system to handle chained, multi-step requests (e.g., “query the database and then plot the results”) by composing multiple sub-agents in sequence within a single session. The architecture was inspired by ADK’s official examples repo.
Sub-agent inventory
The system employs a multi-agent orchestration architecture where a primary Root Agent delegates tasks to specialized sub-agents based on user intent. All agents are powered by Gemini 2.5 Flash, optimised for complex multi-step reasoning, low inference latency, and cost efficiency under high request volume.
Sub-Agent
Core Responsibility
Auditor Agent
Drives autonomous data quality auditing by executing structural and logical checks against BigQuery, maintaining historical context via the Memory Bank.
BigQuery Agent
Facilitates Text-to-SQL (NL2SQL) translation, generating optimized queries and executing them directly against the data warehouse.
Analytics Agent
Performs Advanced Data Analysis (NL2Py) by dynamically generating and executing Python code within a secure Vertex AI sandbox for statistical profiling and visualization.
BQML Agent
Orchestrates BigQuery ML workflows, including model training, batch inference, and model lifecycle management.
Artifact Agent
Handles session-scoped file management to save, retrieve, and list generated execution artifacts (images, CSVs, PDFs).
Report Agent*
Synthesizes audit findings into multi-format reports (Markdown, HTML, PDF, JSON) and manages artifact uploads to Google Cloud Storage.
Comparison Agent*
Executes schema-level and volume-level structural comparisons across discrete BigQuery tables.
Note: The Report and Comparison agents are fully implemented in the repository but are intentionally disconnected from the Root Agent’s execution chain in this evaluation instance.
Key system capabilities
Dynamic Intent Classification: The Root Agent accurately decomposes complex natural language requests, determines the optimal execution path, and dynamically invokes the correct sub-agent chain.
NL2SQL Querying: The BigQuery Agent translates natural language into optimised SQL, executing it directly against the data warehouse to extract and analyze data without friction.
NL2Py Analysis: The Analytics Agent dynamically generates and executes Python code within a secure Vertex AI Code Interpreter sandbox, enabling advanced statistical profiling, custom visualisations, and complex cross-dataset joins.
Autonomous Data Auditing: The Auditor Agent runs a comprehensive suite of structural and logical validation checks against BigQuery datasets, producing structured, reproducible diagnostic reports.
Stateful Memory Persistence: By querying a persistent Memory Bank, the Auditor contextualizes newly detected anomalies against historically resolved or suppressed issues, ensuring the agent learns and adapts from past executions.
Multi-Format Report Compilation: The Report Agent synthesizes raw audit findings into polished, user-preferred output formats and automatically pushes the final artifacts to Google Cloud Storage for human review.
Long-term memory bank
The system’s persistent Memory Bank, hosted on Vertex AI Agent Engine, gives the auditor institutional knowledge across sessions, eliminating cold-start noise and adapting its behaviour to individual user preferences over time. The Memory Bank tracks two custom semantic categories:
“Always include an executive summary”; “Flag outliers beyond 3σ”
How memory is saved
Memory persistence is user-directed. The Auditor invokes the save_memory tool only when explicitly asked (e.g., “…and save these findings to memory”). The Vertex AI Agent Engine then asynchronously extracts clean semantic facts from the session, stripping noise and verbose phrasing, and indexes them against the user’s user_id scope. When a new lesson or correction occurs, the agent doesn’t just blindly append a new memory; instead, it actively scans for similar existing entries. If a related memory is found, the system updates and refines the existing rule rather than creating a duplicate. This deduplication process ensures the knowledge base remains clean, concise, and highly effective, preventing the auditor from getting overwhelmed by redundant information over time.
Agent Engine also persists the full conversation session alongside the extracted facts, meaning the complete interaction history (including tool calls, SQL queries, and agent reasoning) is retained across runs. This gives the system two complementary layers of recall: structured fact memory (distilled semantic facts) and full session continuity (complete conversation history), both managed within a single Vertex AI service.
How memory is loaded
When a query includes a load instruction (e.g., “load memories then check table X”), the Auditor calls the ADK LoadMemoryTool, which runs a similarity search against the Memory Bank scoped to the current user_id. Retrieved facts are injected into the agent’s working context before analysis begins, enabling it to:
Suppress re-flagging of known, already-resolved issues
Apply user formatting preferences from the first response
Re-verify previously detected anomalies to check if they persist
Open HTTP-based standard enabling external agents and services to discover and invoke the system programmatically
Dataset synthesis
Evaluating an autonomous auditing agent requires a controlled, reproducible ground truth, something that real-world production data cannot provide, since errors are unverified by definition. To solve this, we engineered a modular synthetic corruption pipeline that operates on proprietary synthetic datasets designed to mirror real-world marketing dynamics, and produces deterministically corrupted BigQuery tables accompanied by a complete ground truth registry for automated scoring.
Source dataset
To ensure robust and repeatable results, we start with proprietary synthetic datasets giving us complete control and clear visibility into the drivers of campaign performance. The source dataset is a digital marketing performance table comprising 7,618 rows and 87 feature columns. Each record represents a unique daily measurement at the intersection of a campaign, audience segment, delivery platform, ad placement, and creative asset. Columns are organised into six functional groups:
Column Group
Description
Brand & Advertiser
Identity of the brand and advertiser running the campaign
Campaign & Media Buy
Campaign IDs, names, and media buying hierarchy
Geo Targeting
Geographic targeting and exclusion rules (countries, regions, cities)
Audience Targeting
Demographic segments: gender, age group, generation, interests, and behaviors
Delivery & Platform
Campaign objective, platform (Meta/Instagram), device type, and ad placement
Performance Metrics
Funnel KPIs: impressions, clicks, spend, conversions, video plays, video completions, landing page views, add-to-cart events, and purchases
The Performance Metrics group is the most analytically significant: the columns encode a strict, real-world causal funnel (impressions → clicks → landing page views → add-to-cart → conversions/purchases) where each downstream metric is physically bounded by the upstream one. Violations of these relationships (for example, clicks > impressions) are logically impossible under normal operating conditions. This funnel structure forms the basis for all logical error injection. Additionally, the dual attribution windows (immediate vs. 7-day) introduce latent complexity: the complex prompt level successfully identified cross-window contradictions as an un-injected source of potential logical ambiguity.
Corruption pipeline
The pipeline is structured as a three-stage process. Anonymisation is performed first, followed by structural error injection, and concluding with logical error injection. These stages consist of composable modules that can be selectively enabled or combined to produce datasets with precisely controlled corruption profiles. The error rate is fully configurable per stage and can be held constant (for fixed-recall benchmarks) or varied progressively from 5 to 40% (to model the agent’s sensitivity as a function of corruption severity).
Stage 1 — Anonymisation
As a preprocessing step, the pipeline replaces PII and commercially sensitive fields (brand, campaign, creative) with generic identifiers (e.g., brand_1, campaign_1), while cleanly preserving all structural relationships.
Stage 2 — Structural errors
Structural anomalies target individual cells, columns, or rows, and are generally detectable through standard data profiling techniques. This stage consists of five independent injection modules:
Error Type
Simulation / Injection Method
Missing Values (Nulls)
Injects NaN values across a configurable subset of columns to simulate missing or dropped data.
Outliers
Replaces numeric values with statistical extremes (mean ± k × std) to simulate sensor noise or ETL overflow.
Duplicate Rows
Duplicates randomly selected rows and re-inserts them at random positions to simulate pipeline idempotency failures.
Categorical Errors
Replaces valid categories with unique random alphanumeric strings (e.g., a3x7h9) guaranteed not to be in any valid vocabulary.
Schema Drift (Col Drops)
Randomly removes entire columns to simulate upstream data source failures.
Stage 3 — Logical errors
Logical errors are the hardest class of anomalies to detect. Every individual cell value is numerically valid; the violation only becomes apparent when two or more columns are evaluated relationally. This stage injects records that violate any of the following seven business rules:
#
Rule Violated
Condition Injected
1
Clicks ≤ Impressions
clicks > impressions
2
Conversions ≤ Clicks
conversions > clicks
3
Spend requires Impressions
spend > 0 AND impressions = 0
4
Video Completions ≤ Plays
video_completions > video_plays
5
Purchases require Add-to-Cart
purchases > 0 AND add_to_cart = 0
6
Landing Page Views ≤ Clicks
landing_page_views > clicks
7
Non-negative Metric Values
Negative values injected into impressions, clicks, spend, or conversions
Ground truth registry
The evaluation framework is anchored by our ground truth dataset, a structured registry of all 59 BigQuery test tables used in the experiment suite. Each row maps a table’s BigQuery name to its complete injection specification:
the number of logical errors injected (out of a maximum of 7 possible rule types)
the exact error type labels (e.g., clicks_exceed_impressions, purchases_without_add_to_cart)
the number of structural errors injected (out of 4 possible types), and their corresponding labels (e.g., null values, outliers, duplicates, categorical errors)
The registry covers two tiers of test tables: 48 single-error tables (examples 1–48), each containing one isolated error type at varying injection rates of 5%, 10%, 20%, and 40%, and 11 compound synthetic tables (examples 49–59) with progressively stacked errors, starting from a single logical violation and escalating to the maximum combination of all 7 logical and all 4 structural error types simultaneously.
Rigorous evaluation of the auditor agent is essential to ensure it consistently and accurately identifies true data corruption without generating false positives. To accomplish this, the evaluation pipeline uses an automated, four-step process to continuously assess the agent’s performance. First, the pipeline utilises synthetic ground truth data stored in BigQuery tables, seeded with deliberate structural and logical errors (such as NULLs, duplicates, and business-rule violations). Second, the auditor agent is executed against these tables through multiple experimental setups, including prompt comparisons (simple vs. complex queries), table anomaly sweeps, and memory ablation studies (cold starts vs. loading past audits). During these runs, the agent uses its SQL tools to investigate the data and generates a comprehensive final audit report.
Third, rather than relying on slow manual review, we automate the evaluation using an LLM-as-a-Judge approach. A separate Gemini Flash instance receives the agent’s full audit report alongside the complete ground truth registry. Acting as an expert evaluator, the judge compares the outputs and produces a structured scorecard with ✅/❌ verdicts and brief explanations for every error category. This eliminates subjective scoring bias and allows new prompt designs or memory configurations to be evaluated end-to-end in minutes. Finally, these scorecards are parsed to compute precision, recall, and F1 scores per error type, which are then exported to CSV for detailed analysis.
This is also illustrated in the diagram below:
┌────────────────────────────────────────────────────────────────┐
│                       EVALUATION PIPELINE                      │
├────────────────────────────────────────────────────────────────┤
│ 1. Synthetic Data   │ Tables in BigQuery with injected errors: │
│    (ground truth)   │ NULLs, duplicates, outliers, categorical │
│                     │ errors, logical violations.              │
│                     │                                          │
│ 2. Run Auditor      │ 4 experiments test different factors:    │
│    Agent            │  → Exp 1: Prompt Comparison              │
│                     │  → Exp 2: Table Sweep                    │
│                     │  → Exp 3: Memory Ablation                │
│                     │ Agent uses tools to run SQL & produce an │
│                     │ audit report per run.                    │
│                     │                                          │
│ 3. LLM-as-Judge     │ Gemini Flash compares agent report to    │
│    (Gemini Flash)   │ ground truth.                            │
│                     │  → Scores each error: ✅ detected / ❌   │
│                     │                                          │
│ 4. Metrics          │ Parse scorecards → compute precision,    │
│    Generation       │ recall, F1 per error type.               │
│                     │  → Save to CSV                           │
└────────────────────────────────────────────────────────────────┘
Experimental setup
To rigorously validate the Auditor agent’s detection capabilities, we designed a suite of three complementary experiments, each isolating a different factor that influences audit performance:
Experiment 1 — Prompt Comparison: Measures how the complexity and specificity of the user prompt affects the agent’s ability to detect both structural and logical errors, comparing a simple exploratory prompt against a medium-structured prompt and a forensic-level complex prompt.
Experiment 2 — Table Sweep: Stress-tests the agent’s scalability and robustness by sweeping across 11 synthetic tables with progressively stacked error combinations, ranging from a single isolated violation to the maximum of 11 simultaneous error types. This maps the detection ceiling under the best-performing prompt.
Experiment 3 — Memory Ablation: Isolates the contribution of the long-term Memory Bank by comparing a cold-start baseline (no prior context) against a memory-augmented run, quantifying how historical context from past audit sessions improves detection accuracy.
Together, these experiments span the key dimensions of agent performance: prompt engineering, error complexity, and contextual memory, providing a comprehensive view of the system’s strengths and current limitations. All experiments use the same synthetic corruption pipeline and LLM-as-a-Judge scoring framework described above.
Experiment 1: Prompt Comparison
Our first research question was whether prompt specification (instructional structure, domain constraints, and required check set) is a first-order driver of audit performance, independent of the underlying dataset and injected corruption profile. In other words, does increasing prompt information content and enforcing explicit cross-column invariants improve the agent’s ability to surface structural anomalies and relational business-rule violations, and what is the marginal lift as we move from a zero-shot “health check” prompt to a forensic, hypothesis-driven audit prompt?
To isolate this variable, we held the dataset and error profile constant, injecting known errors at a flat 5% rate per type into a table of anonymised marketing data, and varied only the prompt complexity across three levels:
Prompt Level
Description
Simple
Basic health check: explore, verify, report
Medium
Structured assessment organized by data quality pillars
Complex
Forensic audit with cross-column hypothesis testing and business context
Results
To quantify the impact of prompt engineering, we measured the detection accuracy for each of the three prompt levels against our ground truth dataset. The table below summarizes the results:
Metric
Simple Prompt
Medium Prompt
Complex Prompt
Structural errors detected
3/4
3/4
4/4
Logical errors detected
1/7
3/7
4/7
Total score
4/11 (36%)
6/11 (55%)
8/11 (73%)
The Simple Prompt (scoring 4 out of 11) successfully detected missing values, outliers, categorical errors, and negative metric values, but failed to detect duplicate rows and missed most cross-column logical violations. The Medium Prompt (scoring 6 out of 11) was a significant step up; it detected missing values, identified duplicate rows, and found categorical errors, while additionally detecting key funnel violations like clicks being greater than impressions and conversions being greater than clicks. The Complex Prompt (scoring 8 out of 11) was the strongest performer, achieving 100% on structural errors with forensic-level explanations. On logical errors, it detected negative metrics, two funnel violations, and video completion inconsistencies, and the Auditor also discovered un-injected errors beyond the seeded corruption, including data mapping flaws. Our key observations are as following:
Prompt complexity directly impacts detection quality. Moving from simple to complex prompts increased total detection from 36% to 73%.
Structural errors are easier to detect than logical errors. Even the simplest prompt found 75% of structural errors, while logical error detection ranged from 14% to 57%.
The complex prompt exhibited emergent behaviour, discovering data quality issues beyond the injected errors, which validates the agent’s analytical depth. Specifically, it identified a many-to-one mapping flaw where a single campaign_id mapped to multiple campaign_names, and logical contradictions between 7-day and immediate conversion windows.
Error analysis reveals specific failure modes. For the “Spend > 0 while Impressions = 0” error, the agent checked the inverse condition (“Impressions > 0 AND Spend = 0”), demonstrating that the agent’s logical reasoning was sound but directionally inverted. This suggests that targeted few-shot examples or tool-level guardrails could address remaining gaps.
Certain error types remain challenging regardless of prompt level, particularly those requiring knowledge of the full marketing funnel (e.g., purchases without add-to-cart, landing page views vs. clicks). These represent areas for future improvement because evaluating complex logical anomalies requires a deep contextual understanding of domain-specific business rules. Providing this context, whether through a persistent memory system that stores historical performance baselines and funnel definitions, or via highly explicit user prompts that clearly map expected relationships, is essential for the agent to accurately validate these scenarios rather than relying on generic data logic.
Experiment 2: Table sweep
Having identified the complex prompt as the strongest performer, we next evaluated its scaling behaviour under increasing anomaly superposition: specifically, how detection performance (precision/recall trade-offs) degrades or saturates as the number of simultaneously injected error modes per table increases. While a single-error table primarily probes per-check sensitivity, production-like settings exhibit error co-occurrence and interaction effects (masking, confounding, and correlated rule violations) that can materially alter the agent’s search strategy, query budget, and false-positive propensity.
To probe this, we ran the Auditor against 11 synthetic BigQuery tables with progressively stacked error combinations — from a single isolated logical violation up to the maximum of all 7 logical and all 4 structural error types simultaneously (11 errors total per table). All runs used the complex prompt level, allowing us to map the agent’s detection ceiling as the error landscape grows increasingly complex.
Results: Per-table and Aggregate Metrics
*(Legend: L = Logical errors, S = Structural errors)
Table
Error Profile
Expected
TP
FP
FN
F1 Score
synthetic_1_log_error
1L
1
1
0
0
1.000 ✅
synthetic_2_log_errors
2L
2
2
6
0
0.400 ⚠️
synthetic_3_log_errors
3L
3
0
0
3
0.000 ❌
synthetic_4_log_errors
4L
4
4
0
0
1.000 ✅
synthetic_5_log_errors
5L
5
5
0
0
1.000 ✅
synthetic_6_log_errors
6L
6
6
0
0
1.000 ✅
synthetic_7_log_errors
7L
7
7
0
0
1.000 ✅
synthetic_7_log_1_struct
7L+1S
8
2
0
6
0.400 ⚠️
synthetic_7_log_2_struct
7L+2S
9
9
0
0
1.000 ✅
synthetic_7_log_3_struct
7L+3S
10
10
0
0
1.000 ✅
synthetic_7_log_4_struct
7L+4S
11
11
0
0
1.000 ✅
Metric
Value
Perfect Detection (F1 = 1.0)
8 / 11 tables (72.7%)
Total True Positives (TP)
57
Total False Positives (FP)
6
Total False Negatives (FN)
9
Overall Precision
57 / 63 = 0.905
Overall Recall
57 / 66 = 0.864
Overall F1 Score
0.883
We also tested the auditor agent’s baseline ability to detect the same logical error at different prevalence levels (5%, 10%, 20%, and 40%). The agent successfully detected and accurately quantified the discrepancy at the 5%, 10%, 20% and 40% rates, demonstrating robust, range-agnostic capability that catches both rare edge cases and widespread corruption equally well. Ultimately, the results indicate that error rate prevalence does not significantly impact the agent’s detection performance when the audit completes successfully.
Finally, we ran the identical configuration three times for one table as a consistency check, and observed perfect reproducibility: the auditor consistently detected both injected errors with the same metrics and explanations across all three runs. This deterministic behaviour indicates that the complex prompt configuration is stable, reducing the need for redundant audits.
Experiment 3: Memory ablation
The previous experiments characterized the agent’s single-session capability envelope under a fixed prompt specification. In a production setting, however, auditing is inherently iterative and longitudinal: the agent re-encounters the same schemas, recurring anomaly modes, and known “benign” deviations across repeated runs. This motivates a key question: does persistent, user-scoped memory (i.e., accumulated priors from prior audits) measurably improve detection performance and efficiency over time by biasing the agent toward higher-yield checks, reinstating domain-specific invariants without re-deriving them from scratch?
To isolate the contribution of the long-term Memory Bank, we ran the agent twice on the same table under identical conditions, first with no prior context (cold start) and then with memories loaded from previous audit sessions. We evaluated the agent on a synthetic table (synthetic_7_log_4_struct) containing 7,999 rows, deliberately corrupted with 11 distinct error types (4 structural, 7 logical) at a ~5% error rate. The two conditions differed only in whether the agent had access to its Memory Bank before beginning the audit.
Results
Without memory, the agent received a minimalist zero-shot prompt (“Check if there are any errors for table X?”) and relied solely on exploratory analysis. Under these cold-start conditions, it achieved an overall detection rate of 45% (5/11), identifying 2 of 4 structural errors and 3 of 7 logical errors.
When the same agent was instructed to load past context (“load memories about auditing tables…”), the results improved dramatically. By retrieving specific logical checks and known error patterns from prior sessions, the memory-augmented agent achieved a 91% detection rate (10/11), a 102% relative improvement over the baseline.
Structural error detection reached a perfect 100% (4/4), while logical error detection rose from 43% to 86% (6/7), successfully uncovering complex violations such as negative metric values and spend recorded against zero impressions.
The figure shows a clear performance gap between the memory-augmented agent (blue) and the baseline agent without memory (red). For structural errors, memory enabled perfect detection (100%) compared to 50% without memory. For logical errors, memory improved detection from 43% to 86%, demonstrating that access to prior audit patterns and domain knowledge substantially enhances the agent’s ability to identify complex data quality issues beyond basic exploratory analysis.
The sole undetected error was a funnel sequence violation (purchases without add-to-cart). The agent did not miss this check due to a detection failure. It correctly reasoned that the validation was impossible given the aggregated schema, which lacked the transaction-level granularity required to verify a purchase-to-cart relationship. This suggests the miss was an analytically sound decision rather than a detection failure.
Memory vs. prompt complexity
These results raise an important nuance: if a prompt is already sufficiently detailed and structurally prescriptive (as in our complex prompt from Experiment 1), the memory module provides only marginal uplift. However, memory becomes highly valuable in continuous operational scenarios, where its benefits compound over time:
Adaptability: The agent iteratively learns from past edge cases, refining its checks with each audit cycle.
Contextual Awareness: It builds a deep, automated understanding of project-specific business rules and historically common data quality issues.
Consistency & Efficiency: Audit coverage remains stable across sessions, with fewer redundant exploratory queries needed to reach comprehensive detection.
Cloud deployment
The system is deployed as a production-grade, cloud-native service on Google Cloud, following a containerised, infrastructure-as-code workflow from local development through to automated CI/CD and managed compute.
CI/CD pipeline
The project uses a fully automated Bitbucket Pipelines CI/CD pipeline with two distinct execution stages:
On Pull Request: Automated linting and static analysis run immediately to enforce code quality standards before any merge is permitted.
On Merge to main: The pipeline builds two independent Docker images (one for the headless A2A API backend, one for the interactive web UI), pushes both to Google ArtifactRegistry, and triggers rolling deployments to their respective Cloud Run services. All runtime configuration (model identifiers, dataset IDs, memory service URIs, Cloud Storage bucket names) is injected exclusively via environment variables, ensuring no secrets or environment-specific values are hardcoded into the images.
Dual-service deployment architecture
The agent is deployed as two independent, containerised Cloud Run services, each built from its own Dockerfile and serving a distinct class of consumer:
Service 1 — A2A API backend
The backend service exposes a headless Agent-to-Agent (A2A) interface, an open, HTTP-based protocol designed for agent interoperability across frameworks. It publishes an Agent Card (a structured capability manifest) that allows any external service or AI agent to programmatically discover what the Data Quality Agent can do without requiring any knowledge of the underlying ADK implementation.
Clients interact with the backend by sending structured JSON-RPC messages over standard HTTP. This means the auditor can be:
Integrated into classical data pipelines (like Airflow or dbt) to trigger automatic quality checks.
Orchestrated by other AI agents as part of a larger, automated workflow.
Invoked from any programming language, completely independent of the underlying Python stack.
Embedded in CI/CD or alerting systems using simple HTTP requests.
Service 2 — Interactive Web UI
The web UI service hosts an interactive conversational frontend, allowing data engineers and data scientists to interact directly with the full agent system through a browser. It communicates with the agent backend and provides a session-aware interface where users can issue audit requests, review structured findings, retrieve generated reports, and provide manual corrections that are subsequently persisted to the Memory Bank.
Google Cloud Agent Engine provides shared, persistent session storage for both services, ensuring that conversation context and session state survive container restarts and instance scale-out events.
Conclusion
This report demonstrates a highly effective and intelligent agent for automating data quality assurance, utilizing a long-term memory architecture that not only frees up valuable engineering resources but also gets smarter with every interaction. By reclaiming data engineering bandwidth, it liberates engineers to focus on building infrastructure rather than performing manual data QA. It also catches errors in BigQuery tables before data scientists spend hours training models on corrupted data, shifting quality checks earlier in the pipeline. Ultimately, this compound intelligence ensures the system never resets; instead, every manual correction and interaction makes the auditor permanently better and more adapted to our data ecosystem.
Lessons learned
Test with Synthetic Data First: Without a meticulously crafted synthetic dataset, we would have had no objective way to measure if our prompt strategies were improving the agent’s performance.
Memory is Context, Context is King: The ability to retrieve facts from past runs, including past errors, user feedback, and specific constraints, is what makes the difference between a stateless tool and an adaptive auditor.
Start Specific, Then Generalize: We focused on nailing the Auditor Agent’s specific use case with BigQuery first. This created a robust foundation before we expanded to other functions like report generation.
Leverage a Unified Cloud Ecosystem: Building entirely on Google Cloud services (ADK, Vertex AI, BigQuery, Cloud Run, Cloud Storage) eliminated integration friction between components and allowed us to move from prototype to production deployment without stitching together tools from multiple vendors.